
Non-Financial Credit
Summary views: corporate bond market pricing looks reasonable relative value with private markets look attractive on a relative basis with additional diversification benefits though offshore markets are a leading indicator of stress to come.
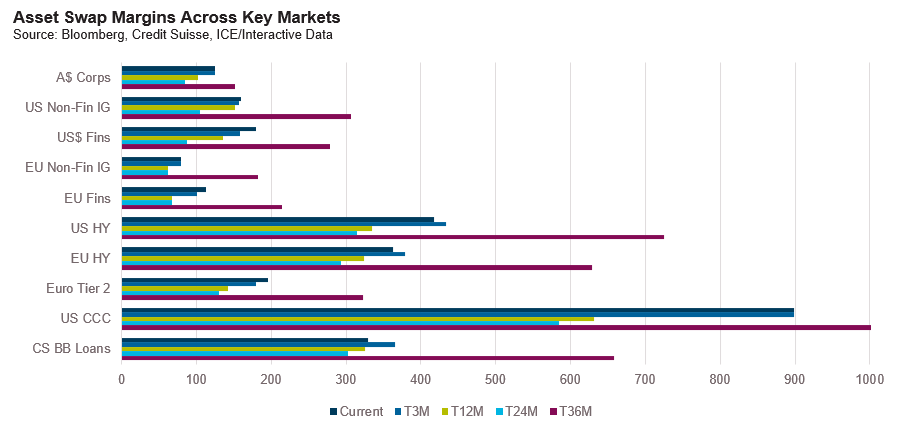
The March quarter is a story in two parts. The first two months of the quarter saw a sharp rally take place as spreads touched levels they had not seen since April/May 2022. US high yield asset swap margins traded inside 400 basis points, 150 basis points inside of the wide prints in June of 2022. However, wider market volatility resulted in virtually all of the tightening of the first two months unwinding with spreads left more or less unchanged over the quarter. Interestingly it was the high yield markets that slightly outperformed investment grade with spreads tightening by 15-20 basis points over the quarter.
Effectively, the higher rate environment and slightly tighter spreads means that leveraged loans have delivered close to a 4% return for the year to date with the strongest returns coming from B rated loans and the weakest coming from CCC and lower rated loans.
Note that in the below chart we have capped spreads at 1,000 basis points as the T36m print was March of 2020, the peak panic point for markets where CCC spreads peaked at 1,363 basis points.
Staying on the US leveraged loan market we continue to see downgrades outpacing upgrades albeit only to a moderate and slowing degree. Within the USD bond market, downgrades have generally outpaced upgrades in 2023 with the notable exceptions of BB’s and CCC’s. Interestingly in European markets net upgrades have been positive across the ratings spectrum.
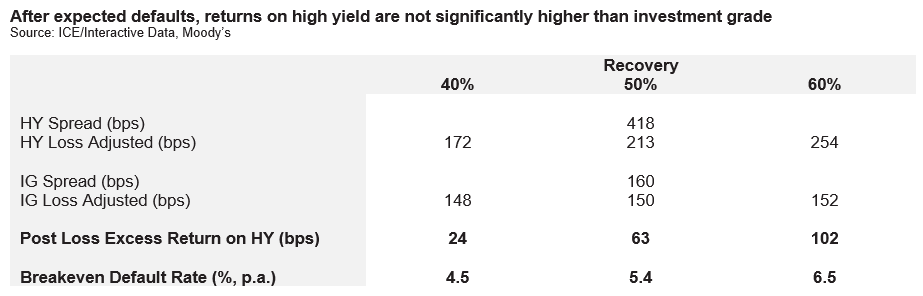
According to Moody’s the global speculative grade default rate came in at 4.2% for the trailing 12 months ended in January. Moody’s predicts this rate to increase to 4.4% by calendar year end and to increase to 4.6% by February 2024. This would be above historical averages but remain well below prior recessionary peaks (7% during COVID, 12% during the GFC). If these forecasts are borne out, there does not appear to be significant upside in high yield credit with loss adjusted spreads broadly flat with investment grade at historical recovery rates.
Relatively low leverage is underpinning Moody’s sanguine default outlook. Morgan Stanley reported that at the end of Q4 net leverage across the loan market declined to 3.6 times. Interest coverage remains strong at 4.8 times but is declining rapidly, down a half a turn over the quarter. This is partially due to higher interest expenses (up 18% YoY) but also due to softening earnings. Also, while an 18% increase in interest expenses may seem significant, consider that the yield to maturity on the Credit Suisse leveraged loan index doubled over the same period. Absent a meaningful reduction in interest rates, it seems inevitable that the median interest coverage ratio will decline below the post GFC low of circa 3 times which was hit during COVID.
Issuers did take advantage of easy financial conditions in 2021 meaning sizeable refinancing volumes don’t really commence until 2025. This will slow the impact of higher interest rates on high yield and leveraged loans borrowers (at least those who have hedged their interest rate risk). The trend is clear; we just aren’t sure how long it is going to take to get there.
When it comes to interest coverage pressure, the greatest risks may lie in private markets. Using Ares Capital Corporation, the largest Business Development Company in the United States, as a guide for the wider market, interest coverage has declined to 1.8 times at the end of Q422 down from 3 times in Q421. Data from Lincoln International suggests that across the private credit universe interest coverage is down to 1.6 times in real time.
This is being reflected in higher default rates. Proskauer’s Q4 2022 Private Credit Default increase was 2.06% for the quarter, up 0.5% over the quarter and up to 5.8% on a trailing 12-month basis, around 1.6% higher than public speculative grade markets.
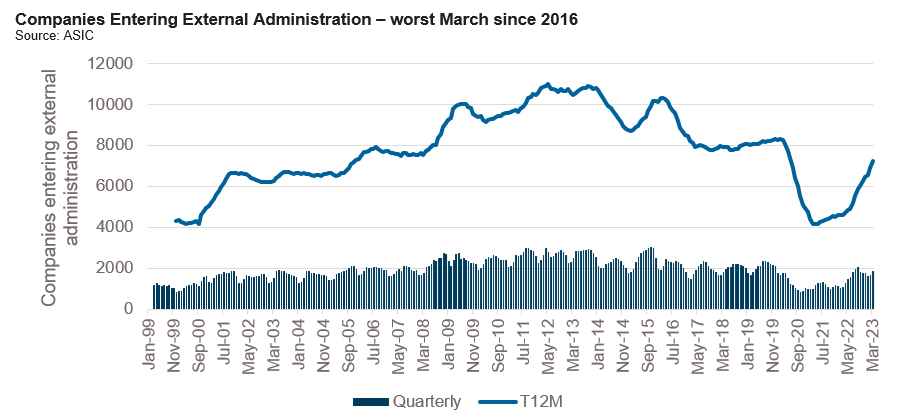
Domestically, defaults in private markets are still relatively low though we would caution that transparency is also much lower than the United States. Insolvency data suggests that defaults are increasing though. During the March quarter 1,882 companies entered external administration, the worst start to a year since 2016.
As has been well publicised, most of the pressure is coming from the construction sector which was responsible for 28% of companies entering administration during the March quarter. This is 10% higher than the share over the period from 2013-2019. Excluding construction, we are still 25% below pre-COVID levels of companies entering into external administration.
Financial Credit
Summary views: financials continue to look cheap to corporates and even securitised product. Credit Suisse situation should support Tier 2 debt markets at the expense of Tier 1. Don’t buy into the story of Australian exceptionalism.
We ended the first quarter of 2023 with four less banks than we started. Much has been written about the failures of Silicon Valley Bank, Silvergate, Signature Bank and Credit Suisse and so we will try to avoid adding to the collective hand wringing over these events and instead focus on broader market implications for the pricing of financial risk.
While spreads in offshore markets reacted to the aforementioned failures the Australian senior unsecured and retail additional Tier 1 market was broadly flat for the quarter. In contrast European and US senior bank debt widened and sits only slightly inside September 2022 levels.
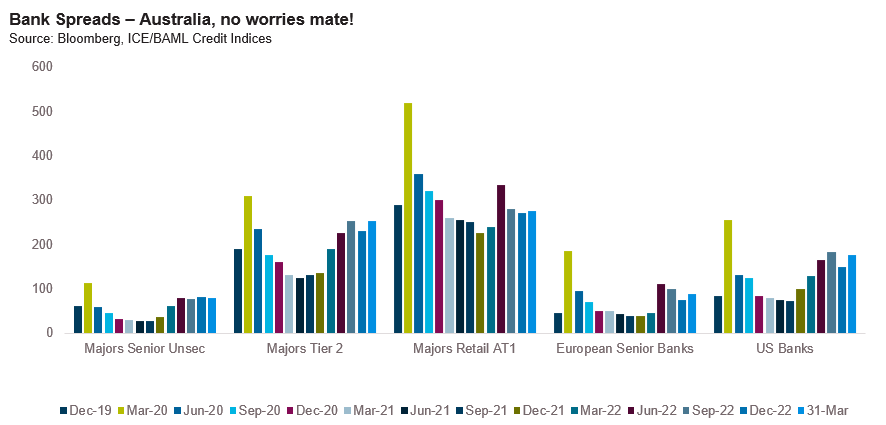
To be fair the domestic Tier 2 market did reprice, the one part of the domestic bank capital stack that seems to move in line with global markets. The lack of movement in the retail Additional Tier 1 was perhaps not surprising given its historical resilience to seemingly all market conditions but still should be placed in context with offshore markets which widened as much of 100 basis points at the wides of the quarter.
Fortunately, prior to the volatility the Australian major banks had taken advantage of benign market conditions to price a large volume of deals. Indeed, it is the second consecutive quarter of more than $50 billion in issuance from the majors.
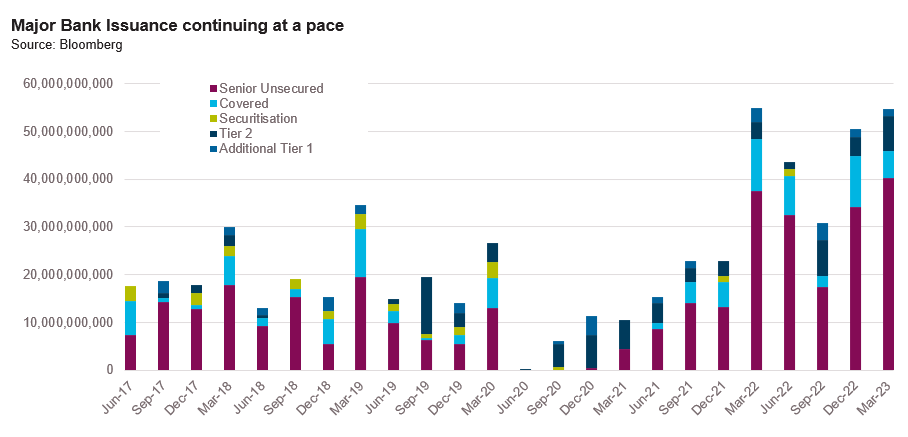
The issuance came ahead of the impending end to the Term Funding Facility (TFF). In the coming quarter only $10 billion of the TFF will mature but in Q3 this increases to $70 billion with the next sizeable tranche being $95 billion that needs to be repaid in Q2 2024. Even with the issuance that has taken place thus far long term debt issued by the banking system is still $40 billion below pre-COVID levels. This reflects both the lack of issuance in 2020 and 2021 but also deposit inflows totalling more than $500 billiion over the past few years.
Unlike Australia, the US banking system has experienced sizeable deposit outflows with around US$900 billion in outflows over the past 12 months. Much of this has occurred in the past month compounded by the SVB dramas and broader concerns over the health of US regional banks. The outflows from banks in the United States have largely gone into US money market funds which offer returns close the the Fed Funds rate, more than 4% over the rates offerred by banks on deposit accounts. While the Australian system is much more closed than the US we would note that banks are similarly uncompetitive in terms of deposit pricing, with online savings accounts offering returns of less than 1.5% versus a cash rate target of 3.6%.
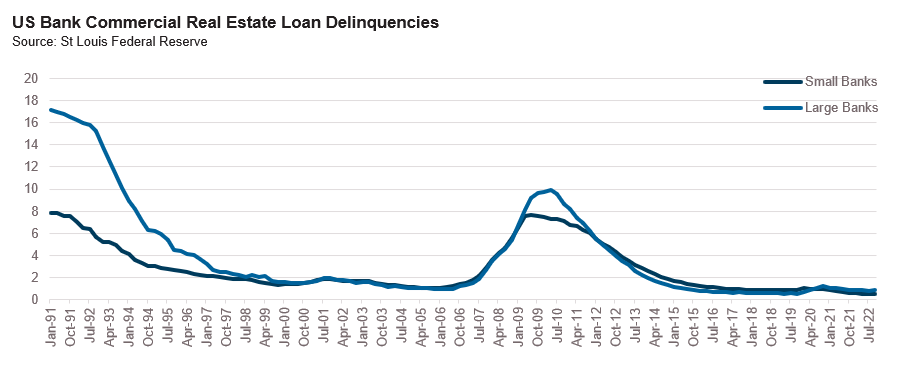
Much of the systemic concern surrounding US regional banks has focussed on exposure to commercial real estate loans with CRE loans making up close to 30% of assets within smaller banks. Exposure within the Australian banking system is far lower with CRE loans less than 10% of total bank assets. We discuss risks in CRE lending in the real estate lending section.
Away from CRE, bank fundamental risk appears low at this point in the cycle. The Australian banking system has been able to generate strong net interest margins by not passing on interest rate increases to depositors despite intense competition on mortgages. We do not think this can persist indefinitely. The RBA has already called out an increased percentage of mortgage borrowers who are drawing down on offset accounts. Eventually even households with excess savings will move money out of the banks in an attempt to earn closer to the cash rate which will likely force the banks to improve deposit pricing. This will impact NIMs and weigh on profitability to the extent banks do not claw back margins through the residential mortgage portfolio.
Early-stage arrears have increased slightly but serious arrears and non-performing loans remain anchored near recent lows. We expect these to pick up but at this stage it appears unlikely that asset quality will present a material issue for the banks.
ABS & Whole Loans
Summary views: technical appear positive with supply in public markets likely to slow. Business models of non-bank lenders remain under pressure- cautious of thinly capitalised monoline prime mortgage lenders who may struggle to call deals
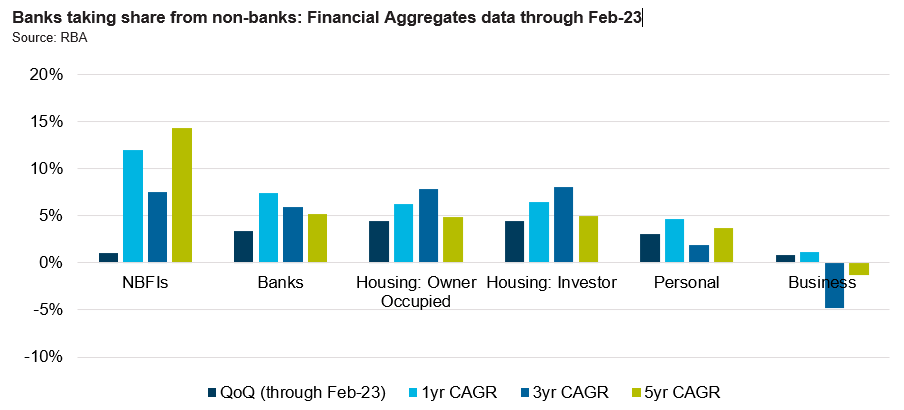
Financial aggregate data showed that over the quarter ending February 2023, banks grew at a much faster pace than non-banks. As we have previously highlighted, competition was most fierce in prime mortgages. In Pepper Money’s recent results announcement, they highlighted that in the second half of 2022 they experienced $3 billion in prepayments across their mortgage portfolio equivalent to an annualised rate of close to 40% which resulted in their book declining by circa 5%.
Pepper noted that the bulk of the competition was in prime mortgages. Asset Finance continued to grow at double digit pace albeit slower than previous periods, likely reflecting a reduced demand for credit in the new higher interest rate environment.
The slowdown in origination activity in the second half of 2022 has flowed through into originations. Primary issuance in Australian dollars was $8 billion, 36% lower than Q1 of 2022 and the lowest first quarter of issuance since 2018. Perhaps in part due to the lack of issuance pricing has started to tighten, most particular in the investment grade part of the capital structure.
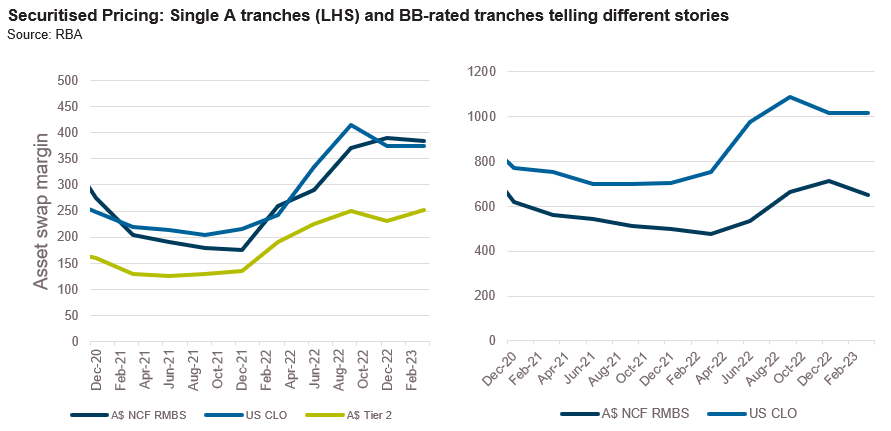
Unlike collateralised loan obligations where pricing on sub-investment grade tranches has widened considerably reflecting the tighter financial conditions and expectations of greater credit losses, pricing on A$ RMBS has continued to steadily tighten since the wides of September 2022.
This is despite arrears rising steadily. Borrowers that can prepay out of non-conforming RMBS pools have done so leaving the remaining pools having much weaker credit performance than previous vintages. Arrears in several non-conforming programs exceeding double digits as compared to credit enhancement at the BB level of around 5%. While these levels of arrears are still unlikely to cause losses on rated notes, it warrants close attention. Higher arrears will trip triggers causing changes in the priority of payments and have the potential to lead issuers not calling transactions where the stub pool is heavily impacted by arrears. In our view the non-call risk continues to not be priced appropriately by markets.
On the surface prime RMBS markets appear much stronger with far lower levels of arrears. However, with banks chasing prime borrowers aggressively, the arbitrage between funding costs and mortgage rates is challenged. To combat this, we have seen creative structuring to pass rating agency tests. This includes deals with step down triggers (margins on notes reduce post the call dates) and threshold rate subsidy mechanisms which allow the issuer to add cash to the structure in order to pay interest. This is clearly not a sustainable business model and leaves us questioning the viability of a prime only non-bank lending model.
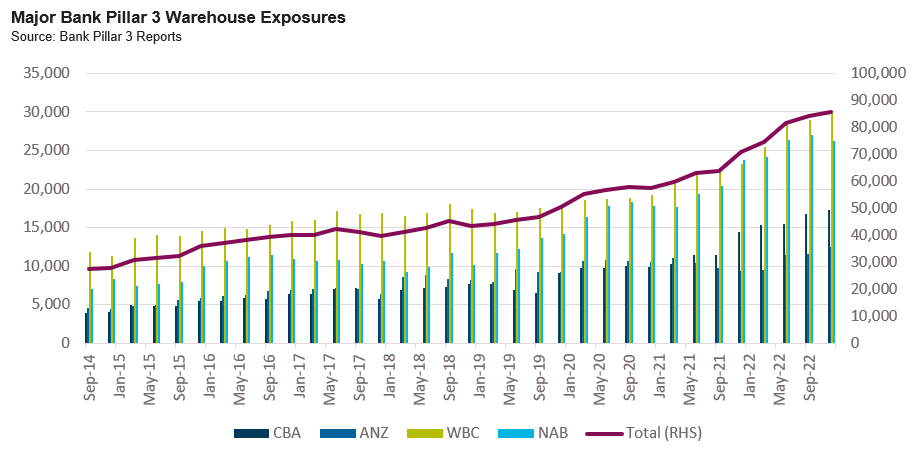
Despite the lower issuance in public markets, warehousing activity in private markets remains highly active. At December year end, major bank warehouse exposures were up to $86 billion, a year-on-year increase of $15 billion. In the second half of the year the pace of increase did slow as the fast prepayment speeds faced by the non-banks began to bite.
Real Estate Loans
Summary views: US is flashing warning signs on office. Australia will likely come under less pressure but will not be immune. The pressure on interest coverage and ultimately valuations should lead to attractive opportunities for non-bank lenders.
In many respects the most unexpected outcome of the SVB failure was the focus on regional bank commercial real estate exposures. The SVB failure was really about interest rates and poor risk management, not commercial real estate fundamentals. But as we all looked for the next shoe to drop, attention was focussed squarely on CRE loans and the substantial exposures held by smaller US regional banks.
Small banks hold US$2 trillion dollars in commercial real estate loans and had been growing exposure at a double digit pace coming out of the COVID pandemic. This is around one-third of all commercial real estate debt in the United States although in recent years the share has been much higher.
There are US$448 billion of loans to refinance in 2023 with US$900 billion in loans due to refinance in 2023 and 2024. To date, there have only been isolated issues and mostly these have occurred outside of the banking system. As at Q3, 2022 (the most recent data we have), arrears within both larger and smaller banks have remained low.
The US$1.6 trillion commercial mortgage backed securities market provides a timelier indication as to what is happening with arrears outside of the banking system. Trepp’s April CMBS delinquency report actually shows a similar trend across the market with 30 day delinquencies actually down over the past 12 months across the entire market (currently 3.1%). This is not equally distributed with strength in lodging, industrial and retail offsetting a sharp decline in office delinquencies which are up over 1% in the past quarter alone and currently sit a 2.6%.
Several high profile defaults have occurred in the office space with Brookfield defaulting on two separate mortgage loans secured by offices in Washington and Los Angeles. And they are not alone with Pimco, a WeWork joint venture, Blackstone and Pimco’s Columbia Property Trust all defaulting on mortgages in recent months. Office valuations are down 25% and vacancies are now over 20% across the entire market.
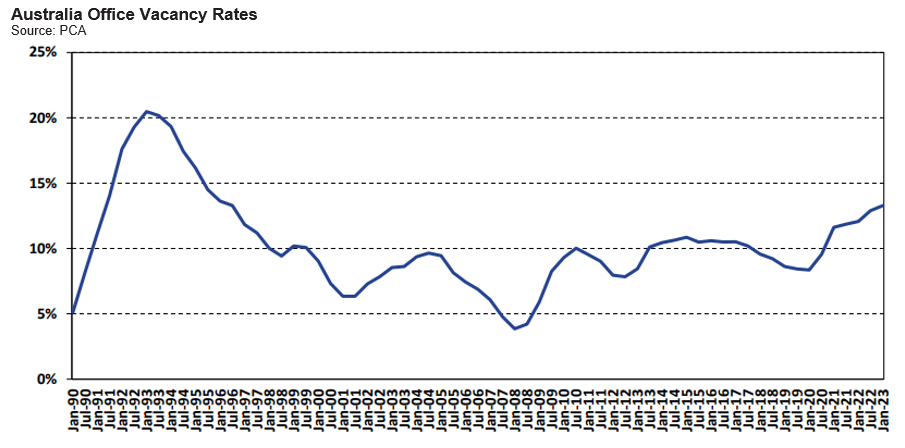
Thus far in Australia we have seen little of the pressure facing US office markets. Fundamentals are similarly weak with office vacancy rates in the mid-teens, the highest levels since the 1990s. Office attendance remains well below pre-COVID levels with Melbourne peaking at 57% of pre-COVID attendance in November 2022 and Sydney peaking at 61% in February 2023. Even less COVID impacted markets such as Perth and Adelaide CBD are still at levels which are 20% below pre-COVID.
Elevated vacancy rates are flowing through to rents which the latest Financial Stability Review noted are still down 10% on pre-COVID levels. With interest rates increasing at the same time, the rubber is hitting the road at interest coverage. Moody’s have noted that for single asset US CMBS that is maturing in 2023 around 40% has a debt service coverage ratio below 1.1x.
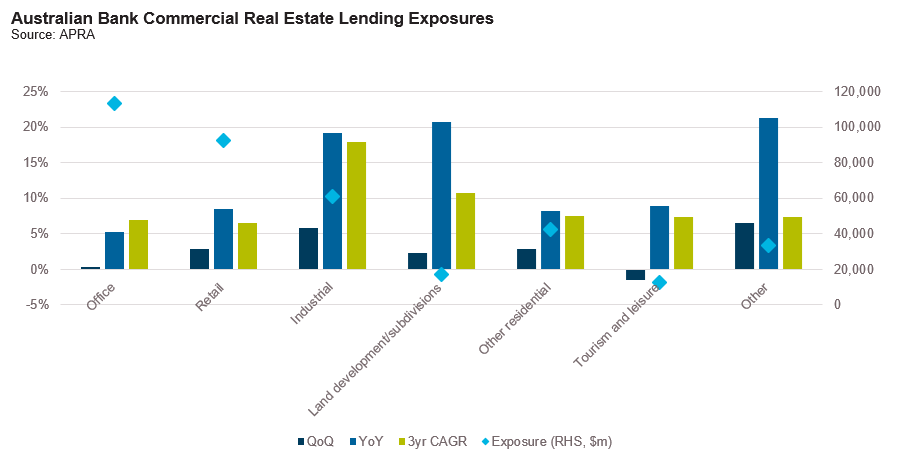
In Australia we have yet to see cap rates move materially but the reality is that they have to. Since the onset of COVID office valuations have increased by over 10% while rents are down 10%. Cost of financing is up considerably with 3-year swap rates up over 3% over the past couple of years. Furthermore, much of the growth in the commercial real estate lending market has occurred in the non-bank sector. Australian banks have not been nearly as aggressive as US regional banks with 3-year CAGRs in the 5-10% area for office and retail, the largest sectoral exposures.
As we turn to domestic private lending markets there is little evidence of pressure. But it must be building. A not insignificant share of the market will face interest coverage pressure as existing loans roll off and this will require recapitalisation by equity or some form of forbearance by lenders. We think the opportunity to refinance these loans at attractive pricing and terms will be significant over the coming years.
As we have highlighted all year, patience is key.
On behalf of the team thanks for reading.
Pete Robinson Head of Investment Strategy – Fixed Income
Disclaimer: The information contained in this publication has been prepared solely for solely for the addressee. The information has been prepared on the basis that the Client is a wholesale client within the meaning of the Corporations Act 2001 (Cth), is general in nature and is not intended to constitute advice or a securities recommendation. It should be regarded as general information only rather than advice. Because of that, the Client should, before acting on any such information, consider its appropriateness, having regard to the Client’s objectives, financial situation and needs. Any information provided or conclusions made in this report, whether express or implied, do not take into account the investment objectives, financial situation and particular needs of the Client. Past performance is not a guide to future performance. Neither Fidante Partners Limited ABN 94 002 895 592 AFSL 234 668 (Fidante Partners) nor any other person guarantees the repayment of capital or any particular rate of return of the Client portfolio. Except to the extent prohibited by statute, Fidante Partners or any director, officer, employee or agent of Fidante Partners, do not accept any liability (whether in negligence or otherwise) for any errors or omissions contained in this report.