Growing Market
2024 was a landmark year for Australian public securitisation, which closed as a record year with AUD$80 billion in issuance. The market has carried much of this momentum forward in 2025. The third quarter alone saw $20.4 billion issued across 24 public transactions, making it the busiest Q3 on record. September in particular saw $13.5 billion placed across 14 deals, a level of activity in a single month not seen since May 2007. Since the GFC, the Australian securitisation market has demonstrated steady, consistent growth, but the recent acceleration signals robust investor appetite combined with increased supply from a growing non-bank issuer base.
Non-banks are the engine
The speed of this growth can largely be traced to an ongoing trend of bank disintermediation that has been a theme of global markets. Australia is no different but has experienced some tailwinds.
The Banking Royal Commission (2017–2019) hit banks hard by exposing misconduct and resulted in the imposition of stricter compliance, governance, and accountability rules. This drove up costs and forced banks to simplify products and accelerate their digital transformation programmes. As a result, their dominance in distribution weakened, opening the door for non-bank lenders to capture market share. The impacts of the Royal Commission also drove several banks to sell parts of their lending businesses to non-bank lenders who rely on securitisation as their key funding source. Names like Angle Auto, Allied Credit and Resimac now require multi-billion dollar annual issuance programs.
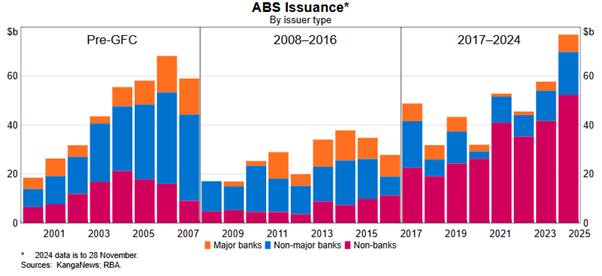
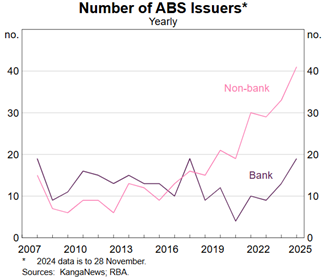
The chart below provides a breakdown of total issuance over the last 25 years by issuer type, splitting out the 4 major banks, other Authorised Deposit-taking Institutions (ADI’s) and non-bank lenders.
Why Australia?
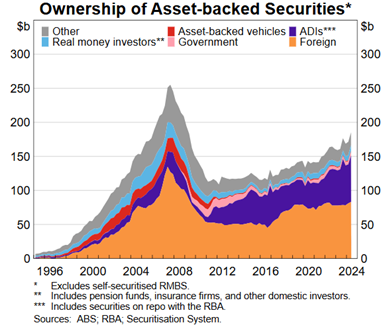
When speaking to Challenger IM ’s clients based outside of Australia, they express an interest in Australia due to its low levels of political and sovereign risk, the long term stable performance of underlying asset portfolios, together with the stability of its legal and regulatory framework, macroeconomic outlook and financial markets. Noting that investors can also earn a spread pick-up relative to comparable transactions in their home markets, it’s not hard to see why we’ve seen such rapid expansion in offshore investor demand in the Australian securitisation market. Even at today’s historically tight spreads, Australian RMBS and ABS transactions offer a 10-25 basis point premium over UK and European comparables, depending on the asset class and risk profile. In fact, according to figures compiled by the Reserve Bank of Australia, roughly 50% of outstanding Australian RMBS and ABS is in the hands of offshore investors. While some larger RMBS transactions will feature foreign currency denominated tranches (typically USD, EUR, GBP or JPY), the vast majority of foreign investment is in AUD denominated tranches.
Private markets benefit from the growth of non-banks
Alongside the public market opportunity, the growth in issuance by non-bank lenders has created a large private market to support ongoing public issuance. As an active participant in warehouse funding for over 15 years, CIM has seen this market increase in scale and sophistication. The private ABS universe has historically consisted primarily of revolving, unrated warehouse facilities. Over the last decade there has however been increasing use of rated warehouses (particularly in the auto and equipment space) and closed pool ‘club’ style private placement ABS transactions. Across this spectrum, attractive premia are available over public markets for investors with the right relationships and ability to underwrite the risk and manage the operational burden.
The increasing depth and maturity of the market has provided opportunities for private markets to fund new asset classes that haven’t traditionally been part of rated, public securitisation markets. As non-bank lenders seek to service underdeveloped market segments, assets including jumbo residential, short term bridge finance, and second lien mortgages have been the subjects of private market interest in both whole loan and warehouse financing formats. Private markets have also been the historic home for more esoteric asset classes such as insurance premium funding, trade receivables, dealer floorplan funding and strata finance.
Increasing diversification by collateral and risk
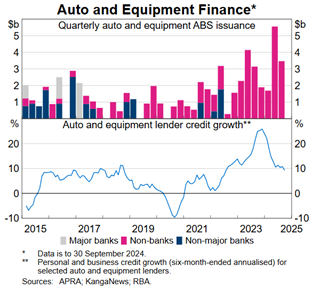
The Australian securitisation market has historically been dominated by RMBS issuance. While RMBS still makes up the bulk of the market, the overall picture is more diverse today. Non-RMBS issuance has grown significantly, driven primarily by auto and equipment finance. In 2024, ABS accounted for 20% ($16 billion) of total issuance, with auto and equipment finance contributing 15% ($12 billion), these proportions having grown from 16% and 11% respectively in 2021. The trend has intensified in 2025. As of Q3, other ABS issuance reached $14 billion (28%), with auto and equipment finance alone at $11 billion (22%).
Additionally, other asset classes such as personal loans, credit cards and unsecured SME lending have emerged as a growing segment. So far in 2025, non-bank lenders such as Plenti, MoneyMe, and Latitude have issued a total of $2.9 billion across 10 “other ABS” transactions (i.e. ABS not secured by auto and equipment loans). For context, there was $4.2 billion of other ABS issued in 2024, which surpassed the $4.0 billion issued over the entire 2015-2018 period combined.
A corollary of the expansion in non-RMBS product has been a greater share of issuance outside of the AAA part of the capital structure. These products demand higher credit enhancement to achieve AAA ratings on senior notes. This creates a greater mezzanine funding need that suits investors looking to access a broader range of risk and return profiles. The creation of highly rated AA and A notes has been of interest to CIM’s global insurance client base looking to extract a premium over similarly rated sovereign and corporate credit.
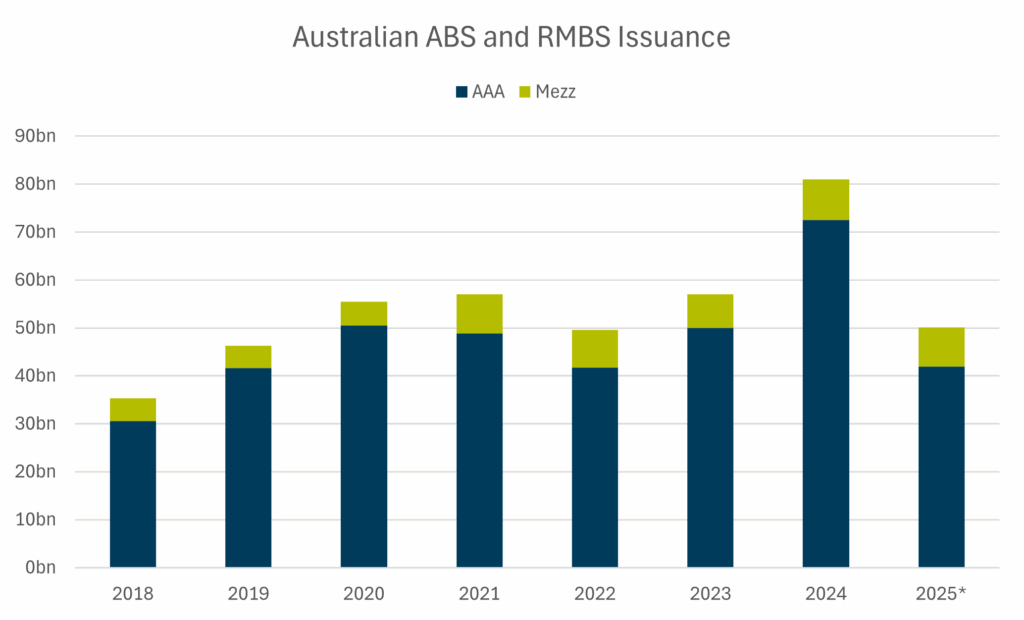
*2025 issuance up to 3Q 2025
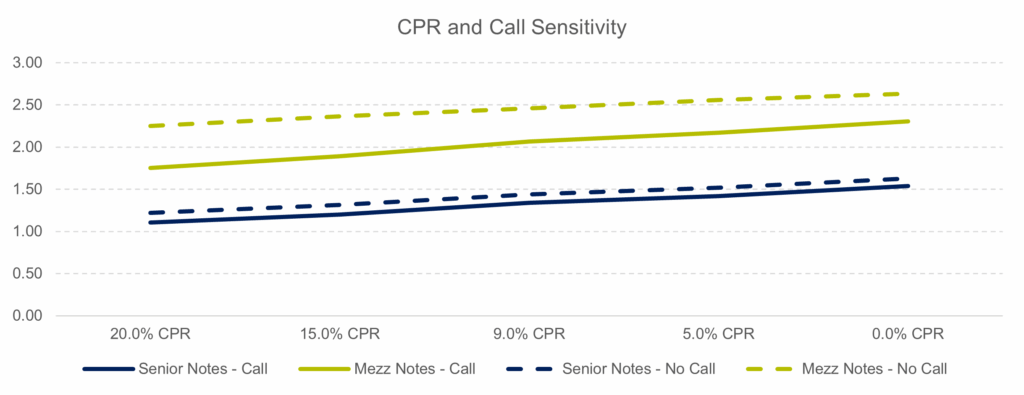
Due to the relatively short duration of the receivables securing these non-RMBS transactions (typically 5-7 years), the mezzanine notes in ABS transactions exhibit significantly less extension risk than equivalent notes in RMBS structures. The mezzanine notes in a recent auto ABS transaction were marketed as having 2.1 year weighted average life, based on 9% conditional prepayment rate (CPR) and the clean up call being exercised at the first opportunity. Based on our internal modelling, the weighted average life of the mezzanine notes would only extend to 2.6 years if the CPR was to reduce to zero and the transaction not be called.
The chart below illustrates the impact on weighted average lives for a recent auto ABS transaction. The mezzanine notes in this transaction were marketed as having 2.1 year weighted average life, based on 9% conditional prepayment rate (CPR) and the clean up call being exercised at the first opportunity. As the chart shows, the weighted average life of the mezzanine notes would only extend to 2.6 years if the CPR was to reduce to zero and the transaction not be called.
Asset Performance
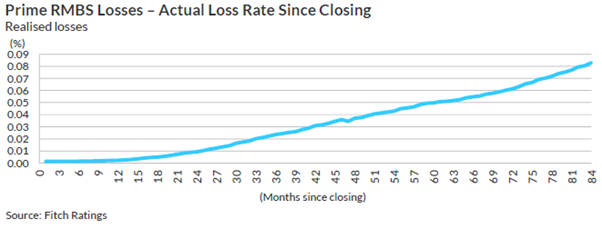
The historic performance of the collateral portfolios securing Australian RMBS and ABS has been exceptionally strong throughout the last two decades. Indeed, [to the best of our knowledge] throughout the history of the market no investor has suffered a credit loss in relation to a holding of rated, publicly issued Australian RMBS or ABS. Even through the Global Financial Crisis (GFC), losses incurred in securitised portfolios in Australia were so low that investors typically look to the experience in offshore markets in designing stress cases for scenario analysis.
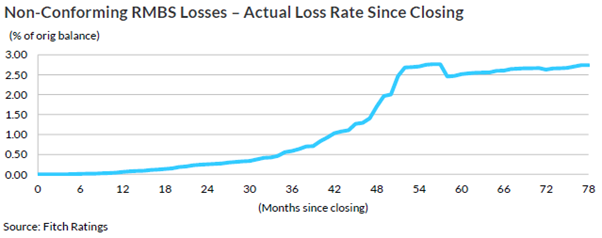
The charts below set out the cumulative realised loss experience in Prime and Non-conforming RMBS transactions rated by Fitch. As can be seen, realised losses in prime RMBS transactions are negligible, while non-conforming portfolios have experienced higher losses, consistent with the higher levels of credit enhancement required.
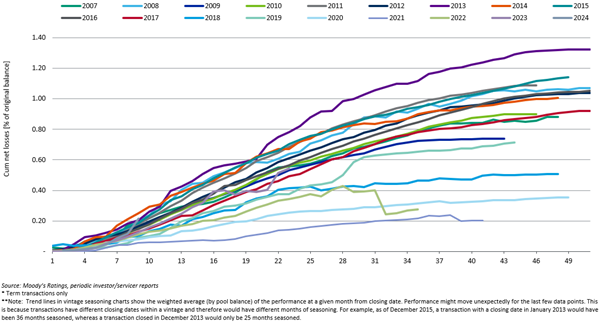
The chart below sets out the cumulative net losses by origination vintage observed in Australian ABS (i.e. non-mortgage) portfolios rated by Moody’s. As can be seen, with the exception of the ‘outlier’ vintage of 2013, the majority of curves are tracking at below 1.2 % with many significantly below. Most transactions underlying the analysis below are secured by portfolios of passenger and light commercial vehicles, and most of the pre-2017 vintages were originated by banks or their subsidiaries. As noted above, however, the Australian ABS market has broadened significantly over recent years in terms of both the number of non-bank originators and the diversity of underlying collateral type, meaning that future cohorts may perform differently.
Improving Evidence of Liquidity
One of the factors that may have restricted interest from offshore investors in the Australian ABS and RMBS market is a perceived lack of secondary liquidity relative to other markets such as Europe, the UK or the US, particularly when it comes to mezzanine tranches. [In CIM’s view / anecdotally] the relative lack of secondary trading in mezzanine tranches has been driven not by a death of buyers, but by a lack of sellers. During the LDI crisis in 2022, UK Pension funds sold down billions of dollars of Australian RMBS and ABS holdings, of which material portion consisted of mezzanine notes. We have also seen an increase in both the number and frequency of “bids wanted in competition” (BWIC) auctions, and the inclusion of mezzanine notes in these processes. The number of mezzanine investors active in the market has increased significantly in recent years, both due to the establishment of new domestic investors and an influx of investors from offshore. Together with the healthy oversubscription levels seen in primary issuance (typically 4 – 7 x across the mezzanine stack), these factors should give investors comfort that mezzanine notes in Australian RMBS and ABS transactions should be readily saleable in an orderly market.
Important Information
This material has been prepared by Challenger Investment Partners Limited (Challenger Investment Management or Challenger), ABN 29 092 382 842, AFSL 329 828.
This document does not relate to any financial or investment product or service and does not constitute or form part of any offer to sell, or any solicitation of any offer to subscribe or interests and the information provided is intended to be general in nature only. This should not form the basis of, or be relied upon for the purpose of, any investment decision. This document is not available to retail investors as defined under local laws.
This document has been prepared without taking into account any person’s objectives, financial situation or needs. Any person receiving the information in this document should consider the appropriateness of the information, in light of their own objectives, financial situation or needs before acting.
This document is provided to you on the basis that it should not be relied upon for any purpose other than information and discussion. The document has not been independently verified. No reliance may be placed for any purpose on the document or its accuracy, fairness, correctness, or completeness. Neither Challenger Investment Management nor any of its related bodies corporates, associates and employees shall have any liability whatsoever (in negligence or otherwise) for any loss howsoever arising from any use of the document or otherwise in connection with the presentation.