
Market Review & Outlook:
Non-Financial Credit:
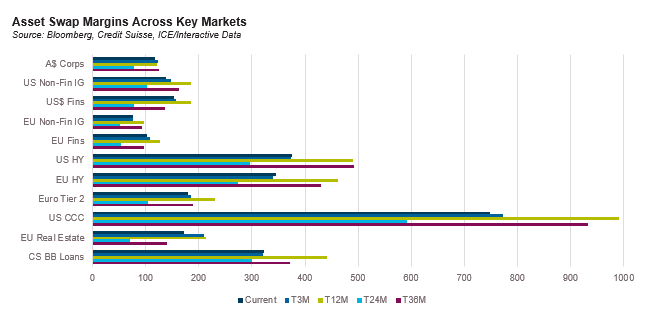
Summary views: attractive outright yields have driven spreads tighter than warranted by fundamentals. Illiquidity premiums are relatively wide which favours some allocation to private over public.
Despite spreads generally rallying over the quarter, momentum faded in September with most risk markets wider. Investment grade markets outperformed high yield with financials lagging and real estate outperforming. Domestically spreads were tighter over the quarter, continuing to benefit from a lack of primary issuance.
Despite our focus on spreads, the story is much more about outright yield which increased across all sectors. US investment grade yields entered October at post GFC highs of over 6% despite spreads which are in line with historical averages. Higher yields are bringing in total return investors who are less focussed on the spread compensation in investment grade. Yields of over 10% for leveraged loans compare favourably with equities trading on a 5% earnings yield.
The reasons for the lack of primary supply can best illustrated by Ramsay Healthcare. In May 2023, Ramsay announced a potential AUD-denominated 5 years senior unsecured transaction. Indications of interest came at margins north of 3%. In September Fitch downgraded Ramsay to BBB- from BBB. In October, Bloomberg reported that a consortium of banks including ANZ, ING, HSBC and MUFG provided Ramsay with a $300 million 6 year loan at a margin of 1.85%.
Bank lending to non-financial corporates is more than 10 times the size of the resident issuer non-financial corporate bond market. Over the last 20 years the bank loan market has grown at 7% per annum versus 4% per annum for the bond market.
Offshore, markets are increasingly focused on borrower fundamentals. What was previous just a story of higher borrowing costs has expanded to include the impact of slowing earnings. Morgan Stanley reported that in Q2 earnings for the median high yield borrower declined for the first time since COVID. Interest coverage continues to decline with the median coverage for loans down to 4.3 times, a 1.2x cumulative decline in 12 months. 10% of all issuers have interest coverage of less than 1.5x with Morgan Stanley estimating that 25% of loan borrowers rated B- already have sub-1x interest coverage.
The weaker fundamental environment continues to flow through into credit ratings with S&P reporting a Q3 downgrade ratio of 54%, most focused in the United States where there were 2 downgrades for every upgrade. Similarly, the United States had an increase in negative bias while Europe improved slightly. S&P continues to forecast a speculative grade default rate reaching 4.5% in mid-2024 with a pessimistic case at 6.5%. Citigroup has a more conservative outlook forecasting a high yield and loan default rate reaching 4.6% and 5.3% up from 3.2% and 4.9%, respectively.
Within private markets interest coverage is a primary focus with Bloomberg estimating that 10% of private credit borrowers held in business development companies may have coverage ratios below 1 times and portfolio interest coverage ratios coming in at around 1.5x assuming current base rates. Non-accruals continue to increase with Fitch reporting a Q2 average levels of 1.2%, up from a 1.0% average in 2022. Perhaps reflecting concerns about the fundamental credit risks facing the sector, listed business development companies traded at an increased discount to net asset value over the quarter.
With public markets tightening, illiquidity premiums in offshore private credit have expanded with JPMorgan estimating that in September 2023 private credit transactions price around 250 basis points wider than public market deals, close to the wides of the year and around 200 basis points wider than September 2022.
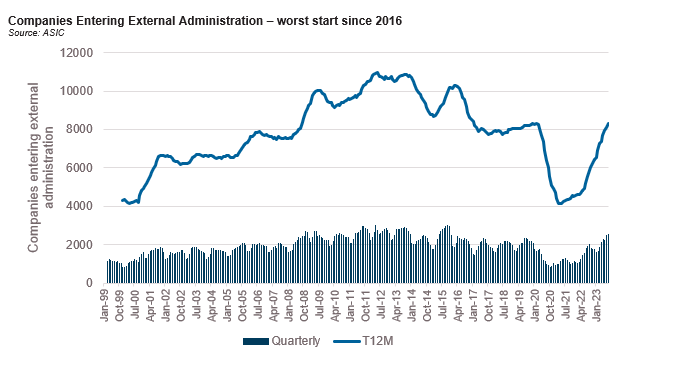
Domestically, defaults continue to increase as evidenced by ASIC data but there have been relatively few defaults hitting private lenders. Our review of the listed private lending funds showed that none reported impairment to the net asset values over the quarter implying no borrowers in non-accrual status. However, we would caution against overreliance on these numbers as the volume of listed private lending funds investing in Australia is less than A$5 billion.
Trailing 3 month defaults are at late 2015 levels when the commodity sector came under significant stress. Defaults continue to be led by the construction sector with 745 construction companies entering into external administration during the September quarter, one-third of the total. In previous quarters construction had only represented around 28%.
Financial Credit:
Summary views: offshore financials have lagged corporates and look attractive despite a weakening macro outlook. Domestically banks are expensive, especially bank capital given the uncertainty of treatment.
With the exception of domestic banks, financial credit lagged non-financial credit in the September quarter. Ostensibly the weakness in offshore markets can be attributed to concerns around unrealised losses on bank balance sheets and slower loan growth.
There is also the spectre of the introduction of Basel 3 capital rules into the US banking system. The final proposal for the US banks were released in July and are expected to result in higher capital requirements by limiting the use of internal models by the banks. Whilst more capital should not be a negative for senior credit spreads, higher risk weights should result in higher issuance of loss absorbing capital instruments.
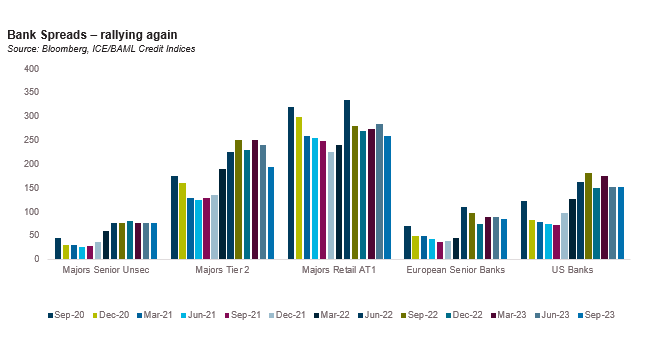
Domestically spreads continue to be resilient with exceptionally strong performance in Tier 2 and AT1 markets. The tightening in subordinated financials in Australia over the quarter contrasts with a 6 basis point widening in the Itraxx Subordinated Financials index.
Much of the strength in Tier 2 markets domestically can be attributed to a lack of expected supply. Year to date issuance is already close to A$9 billion in Australian dollars, in line with 2022’s full year total and less than $5 billion due to be called in the next 12 months. Fundamentals of the Australian banks remain strong. Net interest margins appear to have peaked, but they are still at robust levels and with no signs of asset quality issues expectations are for declines of only around 0.10% in FY24.
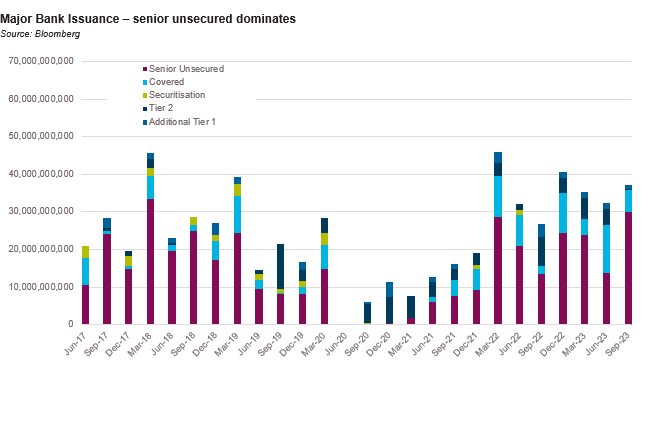
While issuance in bank capital was more muted, senior unsecured issuance was exceptionally strong with major banks issuing over $30 billion, the busiest quarter since March 2018. According to APRA major banks had $467 billion in long term borrowing at the end of August 2023, around 12% of total resident assets. Pre-COVID the majors will funding more than 15% of resident assets in long term borrowing markets. To get back to 15% banks will need to issue another $110 billion in long term funding which is coincidentally very close to the amount of Term Funding Facility still outstanding ($112 billion at 27 September), all of which will need to be repaid by mid 2024.
We can’t finish the update on financials without touching on APRA’s request for feedback on improving the effectiveness of hybrid capital bonds. APRA has raised the question as to whether high levels (APRA estimates over 50%) of retail ownership of Additional Tier 1 instruments impedes the ability of regulators to convert such instruments to equity in a resolution scenario as doing so may undermine confidence in the banks themselves.
For years, institutional investors (including ourselves from time to time) have decried the inefficient pricing of AT1 instruments relative to global comparables and Tier 2 debt. The discussion paper from APRA actually suggests that retail markets were pricing these instruments efficiently all alone. There was lower credit risk for instruments where a larger proportion of noteholders were retail investors because the regulator would be more reluctant to convert the debt to equity in a resolution.
As a reminder listed AT1s trade at spreads in the mid 200s in spread terms versus the unlisted T2 market which is pricing in the very low 200s. Offshore AT1 markets are now re-opened post Credit Suisse with BNP (same snr unsecured rating as the Aussie majors) issuing a benchmark deal in August swapping back into Australian dollars in the mid 400s, around 150-200 basis points wider than the listed AT1 market. Tier 2 from the same issuer is pricing around 50 basis points wide to the Aussie majors. There is significant offshore demand for major bank AT1 issuance and as the majors develop a curve they should price at the tighter end of the global markets, though there may be some cannibalisation of demand from Tier 2 buyers.
With the above considerations in mind we wanted to share our perspectives on the news from a trading and positioning perspective. To summarise:
- There has been minimal reaction from the listed AT1s. This is despite a consensus view that existing listed AT1s will now be grandfathered making the call risk very low and APRA’s admission that exercising a PONV trigger on an AT1 instrument with significant retail participation is unlikely, pricing in the listed AT1 space is virtually unchanged since the news.
- There has been minimal price reaction from the unlisted AT1 market. At best a slight tightening in spreads (<5 basis points) We’d caution reading too much into this however given there are only 2 USD-denominated issuances which both have fairly short call dates.
- Minimal price reaction in T2 markets. We’ve seen decidedly little commentary on this but probably because it is very hard to predict the impact. If the banks decide to keep issuing AT1 but in the unlisted market, spreads will likely widen on technicals (the A$ listed AT1 market and A$ unlisted T2 market are both in the vicinity of $40bn market sizes) but if they elect to simply replace AT1 with equity then there is arguably a small positive though spreads are already fairly tight in our view.
- Bank equity traded off on the news by around 0.5% relative to the index ex-banks. A pretty muted reaction all things considered as this looks negative for equity under all possible permutations (but perhaps reflective of a market discounting the likelihood of APRA going so far as to ban AT1 being sold to retail which may be fair given their track record)
- Broader credit was largely unchanged. There are 2 sides to this story: one, a potential for more supply in unlisted A$ credit which will drag broader credit markets wider and two, an increased cost of capital for banks which will increase the cost of debt in the bank loan market. Both are supportive longer term for A$ credit investors.
ABS & Whole Loans:
Summary views: consumer has proved to be more resilient than expected, favourable supply/demand technical is moderating, relative value favours sub-investment grade tranches albeit to a lesser extent than previous quarter
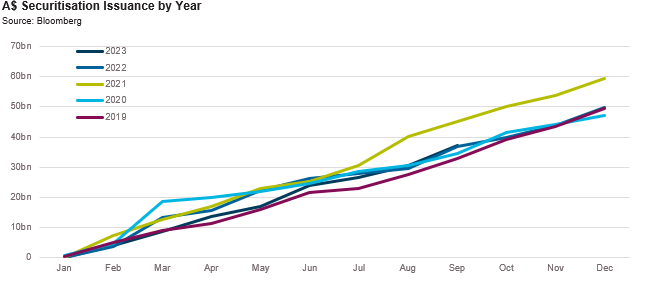
Favourable financing conditions have allowed the domestic securitisation market to stabilise through end of August 2023. Primary issuance over the quarter was close to $4.5 billion, not materially higher than the first half of the year which was $4 billion suggesting that the pace of prepayments has started to slow.
At some point we expect to see some credit burnout as stronger borrowers pay down debt and there are early signs that this is starting to happen, even in advance of any increase in unemployment. According to the S&P SPIN index, prime RMBS 60 day plus arrears bottomed at 0.49% in late 2022 and have steadily increased to 0.68% as of August 2023. The move in non-conforming RMBS has been more material with 60 day plus arrears at 2.26% in August 2023, up from 1.37% in September 2022. Both figures are broadly in line with pre-COVID levels.
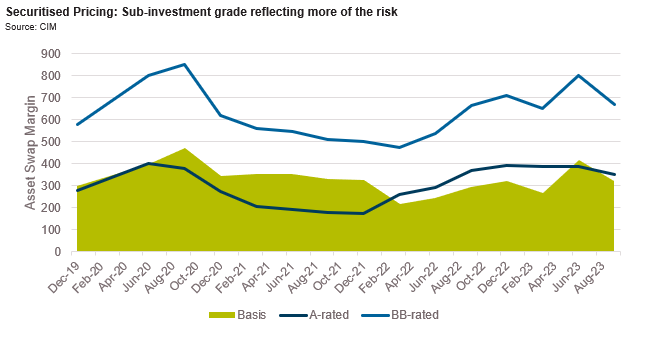
As we have previously noted, markets are pricing the rise in arrears and expectations of further increases. Sub-investment grade tranches are lagging investment grade markets with the basis between A and BB tranches of non-conforming RMBS deals at 3.20%, having been as tight as 215 basis points in 2022.
The more credit sensitive parts sectors within ABS are proving to be similarly resilient for now to the higher interest rate environment with arrears more or less unchanged from pre-COVID levels and only increasing moderately from the lows of 2022. To illustrate, a major credit card issuer is showing 60 day plus arrears of just over 2%, flat to 2019 and around 0.5% higher than 2022 levels.
Offshore spreads are similarly tight, with only CMBS and agency MBS trading wider than averages of the last two years. From an arrears perspective, the data is also benign reflecting a more resilient consumer than we had anticipated. Arrears have increased from the lows of 2022, with US non-qualifying mortgage RMBS 60 day plus delinquencies at 2.2%, up from 1.3% prior to COVID. However, we’d caution that more credit intensive sectors are increasingly showing signs of stress. Subprime auto ABS delinquencies are over 5% with, around the highest levels of the last decade.
Real Estate Loans:
Summary views: Fundamentals are poor and financial conditions continue to tighten. Despite this, non-bank lending markets remain open with no signs of performance weakness.
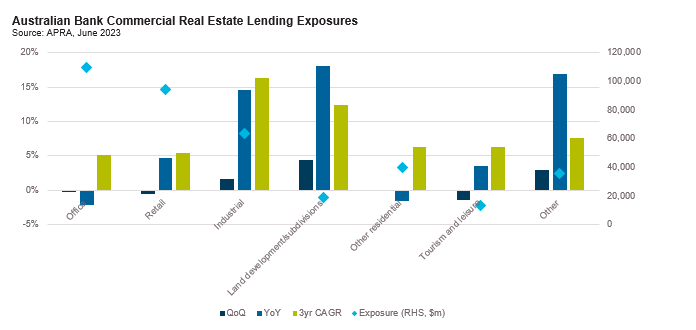
Office, retail and tourism and leisure related commercial real estate debt exposures declined in the June quarter with Office down 2% on a year over year basis. This is the sharpest decline in office exposure since 2011.
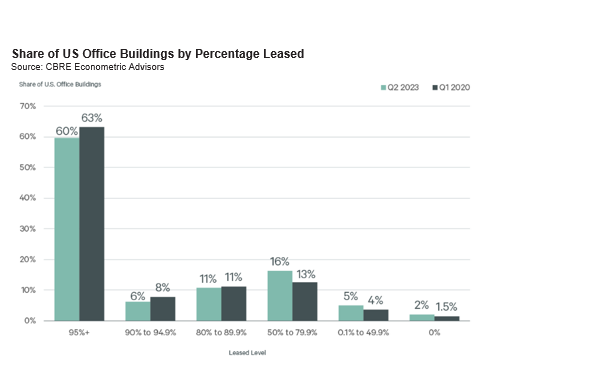
Risks facing the sector are front of mind for investors. The RBA discussed global CRE markets in the latest Financial Stability Review, noting that price declines to date had been at the lower range of global developed markets. Office vacancy rates continue to rise globally. In the United States, CommercialEdge reported a 2.6% increase in the national vacancy rate to 17.50% with the average listing rate declining 2.2% over the year. Most observers expect vacancies to continue to increase approaching 20% by mid 2024. The market is very binary with CBRE highlighting that two-thirds of all US office buildings were over 90% leased in Q2 2023, not far the 71% level in Q1 2020. The issue is in the tail where the share of buildings that have more than 20% vacancies increasing from 18.5% to 23%.
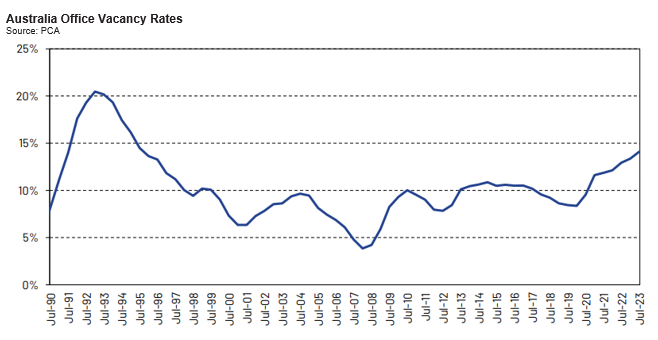
The fundamental story is marginally better in Australia though moving in a similar direction. Office vacancy rates continue to increase, showing no signs of stabilisation. Cap rates are pushing high with Citigroup reporting a cumulative 44 basis points of widening over the twelve months ending June 2023.
Offshore the stress continues to build. According to data from Trepp the special servicing rate for CMBS loans climbed to 6.87% in June, a 0.45% increase over the past quarter. The office sector continues to underperform reaching 8.34%, a 4.9% increase since the start of the year. We are seeing similar trends in delinquencies with 5.58% of office properties in CMBS now 30 or more days delinquent, up from 4.50% only a quarter ago. This is flowing through to ratings actions with S&P reporting a rolling 1 year upgrade to downgrade ratio of 0. So far in 2023 there have been 188 downgrades and 1 upgrade.
Domestically there are few signs of stress. Despite construction firms making up a record 30% of insolvencies, defaults on real estate linked debt remain low. Through 30 June 2023, non-performing exposures on bank balance sheets are only 0.5% of total exposures, unchanged over the last 12 months. While there is less transparency from the non-bank sector, anecdotally it appears credit performance remains strong, despite the headwinds we have cited.
Disclaimer: The information contained in this publication has been prepared solely for solely for the addressee. The information has been prepared on the basis that the Client is a wholesale client within the meaning of the Corporations Act 2001 (Cth), is general in nature and is not intended to constitute advice or a securities recommendation. It should be regarded as general information only rather than advice. Because of that, the Client should, before acting on any such information, consider its appropriateness, having regard to the Client’s objectives, financial situation and needs. Any information provided or conclusions made in this report, whether express or implied, do not take into account the investment objectives, financial situation and particular needs of the Client. Past performance is not a guide to future performance. Neither Fidante Partners Limited ABN 94 002 895 592 AFSL 234 668 (Fidante Partners) nor any other person guarantees the repayment of capital or any particular rate of return of the Client portfolio. Except to the extent prohibited by statute, Fidante Partners or any director, officer, employee or agent of Fidante Partners, do not accept any liability (whether in negligence or otherwise) for any errors or omissions contained in this report.