Market Review & Outlook:
Non-Financial Credit:
Summary views: rally in spreads and yields makes public and private credit marginally less appealing especially as signs of fundamental weakness emerge. In public markets we are favouring investment grade based on more attractive valuations and seeing value in private high yield where illiquidity premiums are still relatively wide.
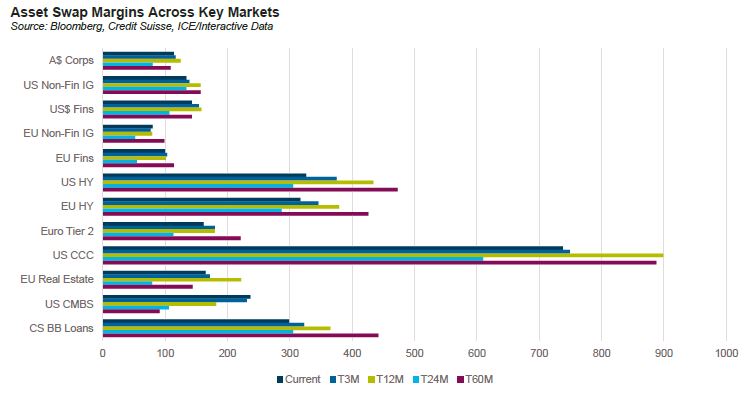
Credit spreads rallied in the final quarter of 2023 ending up at the tights for the year, yet still considerably wider than the COVID tights hit in mid-2021. Even European real estate credit, a sector we have called out as an underperformer repeatedly during the year, rallied in the final quarter.
In a relative sense high yield has outperformed with spreads sitting at around 60% of the wides of the past 24 months. Investment grade spreads are around 70-80% with financials underperforming relative to non-financials. This is also true when comparing to pre-COVID spread levels. US high yield bonds are sitting at 81% of the 2015-19 average spread levels with BB-rated loans and CCC-rated bonds at 90%, respectively while US financial credit is at 117%.
Australia stands out as the weakest performer with spreads at 90% of the two year wides. Over a longer horizon, spreads are 109% of the 2015-2019 average levels, wide but less wide than US and European financial credit.
Part of the justification for the strong rally was the alleviation of the pressure in rates markets. Following the “Powell Pivot” the yield to maturity on the ICE/BofA US Broad Market index declined from 5.8% in October to end the year at 4.6%. While this is an extreme move, it’s worth recalling that the yield at the start of 2023 was actually lower at around 4.3%.
Another factor is net issuance. According to Citigroup the leveraged loan market, one of the strongest spread performers in 2023, actually shrunk by 1% ending at US$1.4 trillion. This is the first contraction for the market since 2010. In the high yield bond market, the story was similar with the face value of the ICE/BofA US High Yield index hitting US$1.3 trillion, down 15% on the mid 2021 peak. Only some of the market shrinkage can be attributed to net rising stars; upgrades to investment grade outpaced downgrades from investment grade by around US$60 billion. Certainly, the growing private credit market has taken market share from public credit markets as well. Regardless of the cause, the effect is less supply which helped hold spreads in over the year.
Net issuance was healthier in the investment grade market with the face value of the US corporate index growing to US$8.7 trillion, up over 10% on the year with growth in both financial and non-financial credit. The story was more mixed in Europe with non-financial par value flat but financials up just under 5%. In Australia, the market increased strongly over the year with long term financial debt outstanding up 20% to A$222 billion and non-financial corporate debt up to A$78.5 billion, a 9% increase.
Adding to the supply pressures faced in investment grade markets was the impact of quantitative tightening. In Europe bond holdings under the Corporate Sector Purchase Program (CSPP) declined by EUR20 billion in 2023 and is expected to decline by over EUR30 billion in 2024 which will see it finish the year just under EUR300 billion at amortised cost. While other central banks did not acquire corporate bonds, all bar the BoJ are engaging in some form of quantitative tightening which will weigh on markets.
Another supportive factor for credit spreads has been the relatively benign credit environment. According to Moody’s trailing 12-month rating drift (measured as notch upgrades less downgrades divided by rated issuers) moderated over the year ending November at -6.1%, an improvement from February where it was -9.5%. Rating drift in the United States is -11%, the weakest level since the onset of the COVID19 pandemic. Despite the somewhat benign signal, we think caution is warranted for a few reasons.
Firstly, interest burden has yet to increase materially. The average coupon on the US high yield index has only increased by 0.48% since bottoming in early 2022. Contrast this with the 5.5% increase in LIBOR over the same period. In the high yield bond market interest coverage remains above 4 times. In leveraged loan markets median interest coverage has declined to around 3.5 times and in private markets interest coverage has declined from 2.8x at the peak to 1.8x at the end of the third quarter (data from RBC who average across multiple US business development companies).
Secondly, many borrowers have elected not to refinance debt at today’s interest rates and are waiting/hoping for a better entry point. According to Apollo the share of high yield bonds maturing in 1-3 years is 20% in the US and over 40% in Europe, both 15-year highs. As these deals refinance the interest burden faced by borrowers will increase placing pressure on spreads in both a technical (more supply) and fundamental (lower interest coverage) sense.
Lastly, earnings have been resilient across the credit spectrum. The Golub Capital Altman Index for middle market private companies showed revenue up 7.4% year on year through December 2023 with earnings up 16.3%. Looking forward according to Bloomberg, consensus EBITDA on the S&P500 is expected to increase by 10% in 2024 having increased by 5% in 2023.
These factors have helped keep defaults relatively low in both public and private credit markets. According to Moody’s speculative grade default rates are around 4.5%, below the COVID peak of 6.9% and the late 2016 levels of 5%. Notably in late 2016 high yield spreads were considerably wider than today’s levels, perhaps better reflecting the default environment. According to the Lincoln Private Market index, covenant default rates were 3.9% at the end of Q3, down from 4.2% at the end of the second quarter though Lincoln does highlight that in the first 9 months over 15% of companies tracked by Lincoln executed an amendment to a covenant, implying the 3.9% may understate the true level of stress. Domestically we continue to track ASIC insolvency data closely. This continues to show an increasing trend which has yet to reach an inflection point. Indeed, insolvencies in the December quarter (data only up to 24 December) are the worst since December 2013.
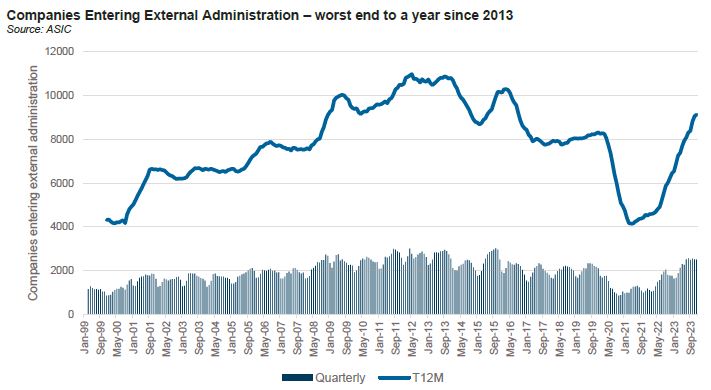
Furthermore, insolvencies are spreading beyond the construction sector. Over the December quarter the construction sector was responsible for only 24% of insolvencies having averaged 29% in the 12 months prior to that. Offsetting the relative decline in contribution from the construction sector has been sharp increases in contribution from Accommodation & Food Services and Other Services. Both sectors are cyclical and impacted by slowing discretionary spending implying households may finally be tightening their belts.
Financial Credit:
Summary views: Australian dollar financials are expensive relative to offshore. Retail bank capital is prohibitively expensive.
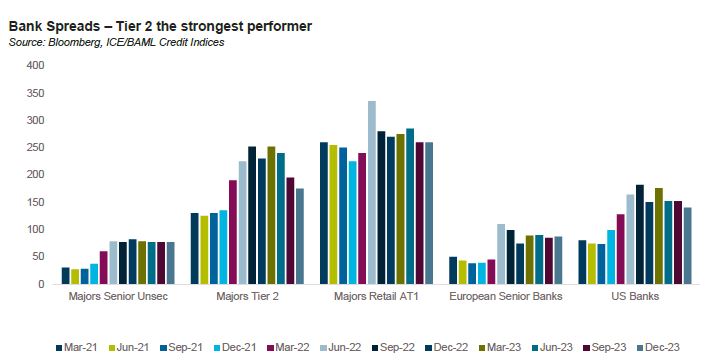
Tier 2 subordinated bank capital was the star of the final quarter of 2023. Major bank Tier 2 tightened by around 20 basis points over the quarter strongly outperforming bank senior and additional Tier 1. US bank paper also performed well ended the year circa 10 basis points tighter, quite a feat given bank failures in Q1 and ongoing stress faced by the regional banks.
Offshore credit outperformed equities over the year with KBW Bank Index down 1% for the year, currently trading at a forecast earnings yield of 9%. In contrast in Australia equities performed strongly with the ASX200 Banks index delivered a 14% return for the year and trading at a forecast earnings yield of 7%.
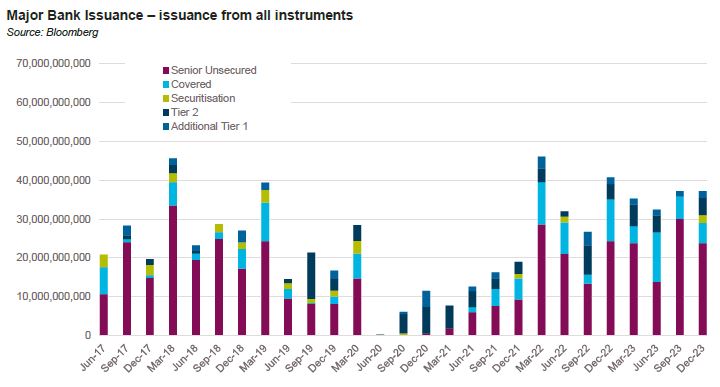
2023 saw A$11 billion in Tier 2 issuance by the major banks into the Australian market and A$17 billion in total, slightly down on 2022 and 20% down on 2021’s issuance of A$21 billion. The banks are approaching January 2026’s new TLAC targets in reasonable shape with Deutsche Bank estimating A$37 billion in gross issuance requirements over the next two years which is less than 2020/21 when the banks issued close to $41 billion.
With the Term Funding Facility rolling off, issuance of senior unsecured picked up in 2023 and is expected to be even higher in 2024. Major banks issued over A$90 billion in 2023 and have close to $70 billion in maturities in 2024.
An interesting fact in recent quarters has been the strength in demand in Australian dollars for both bank senior unsecured and Tier 2. Banks issued 55% of senior unsecured and 64% of Tier 2 in Australian dollars which are both considerably higher than historical levels. Australian dollar bonds are pricing well inside the US dollar curve with Tier 2 pricing estimated to be anything from 35-50 basis points wider in USD versus Australian dollars.
While hard to discern from public commentary we suspect superannuation funds have been the marginal buyer of Australian dollar bank paper. Superannuation funds have materially increased their holding of fixed income and commentary from fund CIOs suggests they have a positive disposition towards the bonds.
Moves in the Additional Tier 1 market were more muted as investors continue to digest APRA’s request for feedback on improving the effectiveness of hybrid capital. We discussed this last quarter and have seen little newsflow on the topic though would note that Australian retail AT1 instruments still trade considerably tight to offshore markets. Consider a benchmark USD AT1 issued by BNP, rated BBB trading around 400bps back to AUD. This is around 140 basis points cheap to the retail AT1 market compared to Tier 2 debt which trades around 35 basis points cheap.
From a fundamental perspective there is nothing of note to call out either domestically or globally. Delinquencies remain low, banks are adequately capitalised and even US regional banks have seen deposit outflows subside and reverse with a US$250 billion increase in the second half of the year.
ABS & Whole Loans:
Summary views: securitisation valuations look cheap to corporates, but caution is warranted given the inflow of unsophisticated capital into the market plus the relative weakness of non-bank originator balance sheets.
The Australian securitisation market found another gear in the final quarter of 2023. Taking advantage of more favourable issuance conditions, securitisation issuers placed over A$18 billion in bonds into the public markets, the most active fourth quarter in recent history.
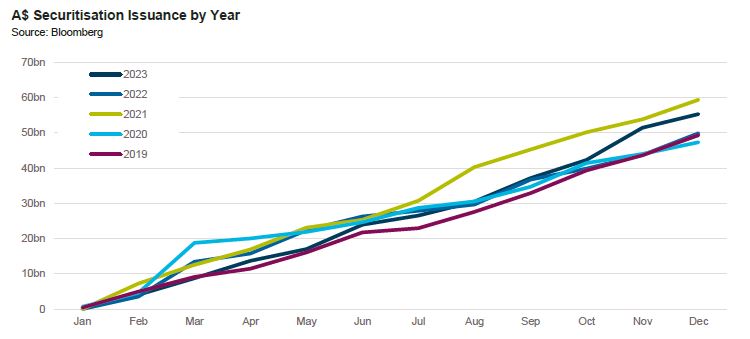
Despite the strong levels of gross issuance, the securitisation market has actually shrunk over the past 12 months, down A$1.8 billion to A$153.8 billion with all of the decline attributable to RMBS which fell A$9.6 billion over the same period. The declines in RMBS are due to fast repayments on mortgages and the well publicised mortgage pricing war where banks effectively priced non-banks out of the prime end of the mortgage markets.
Australia, typically considered part of Europe by securitisation investors, was the largest overall contributor to issuance in 2023. The United Kingdom was second with Germany following well behind. Most issuance was prime RMBS followed closely by autos. With the ECB still active, placed issuance was 40% of the market, one of the highest levels in recent years. With the ECB discontinuing all reinvestment of principal from July 2023, the proportion of placed issuance is expected to increase further in the coming year.
According to JPMorgan, US ABS issuance was US$256 billion, the second busiest year in recent history after 2021. They also called out US$139 billion of US CLO issuance and EUR28 billion of EUR CLO issuance. Each were slightly down on 2022 issuance levels which is understandable in the context of a lack of issuance in leveraged finance markets. Notably given the shift towards private markets, private credit/middle market CLO issuance was close to a quarter of the US CLO new issue market.
Fundamental performance remains resilient. Within mortgages, delinquencies have ticked up in Europe and Australia and excess spread has declined but not to levels which are expected to result in credit impairment. In the United States consumer and subprime auto loan delinquencies are around peak levels for the past 5 years and are trending higher. In the CLO market, rallies in loan prices are supporting market value over-collateralisation levels but CCC buckets are increasing in both broadly syndicated and middle market CLOs and are now well above pre-COVID levels at 6.4% and 10.5%, respectively.
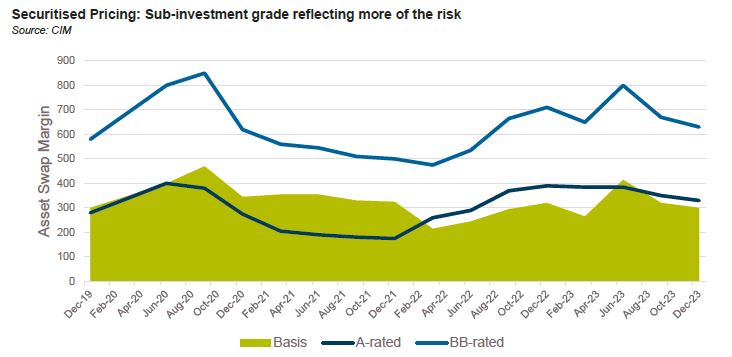
With such a strong rally in spreads the credit curve has flattened in Australian non-conforming RMBS. CLO’s, generally the higher beta product, have also rallied strongly with BB’s close to 200 basis points tighter over the past 12 months and A-rated paper almost 100 basis points tighter. Over a longer time horizon, both CLO and ABS spread levels remain slightly cheap to pre-COVID averages, which implies some relative cheapness to corporate paper.
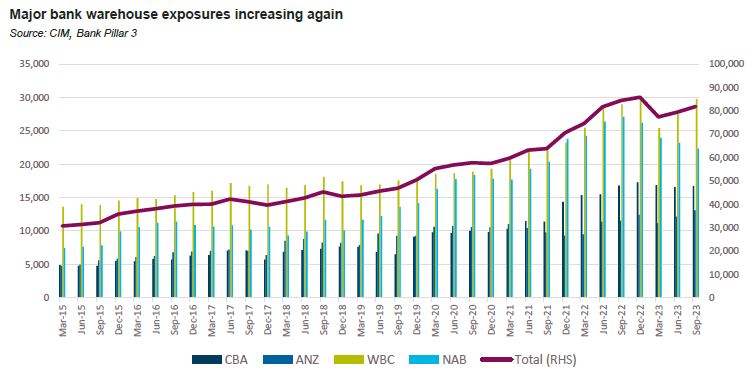
Major bank warehouses increased over the quarter but declined on a year on year basis (though September 2023) as non-bank originators found more favourable origination conditions during the second half of the year. There has been a significant uptick in interest in the sector with traditional fixed income funds and superannuation both new entrants to the sector. This has driven some weakening in terms and large dispersions in pricing of facilities. Share price performance amongst listed non-bank originators has been positive even as the jury remains out on the ability of the sector to pivot to long term sustainable profitability.
Real Estate Loans:
Summary views: Despite weak fundamentals, decline in interest rates will alleviate pressure on cap rates. Private markets should grow increasingly attractive as 2021 vintage loans come up for refinancing.
Bank lending exposures to commercial real estate increased strongly in Q3 with growth observed across all sectors and aggregate growth annualising to over 30%. Of particular note was the increase in land development/subdivisions and other residential which both exhibited quarterly growth rates annualising to over 50%.
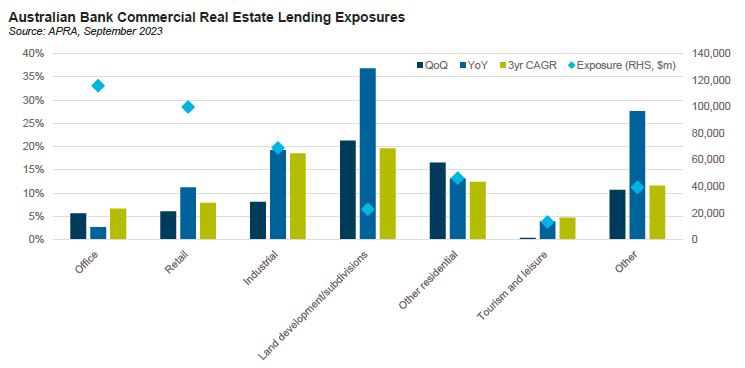
Despite the growth there was a meaningful increase in non-performing exposures which increased from 0.5% to 0.7% of total exposures. The weaker fundamental performance is not a surprise and aligns with the experience in global markets.
In the United States delinquency rates on commercial real estate loans across all commercial banks bottomed at 0.64% in Q322 and has increased to 1.07% as at Q323. More recent data suggests that the increases will continue. Trepp reported that US CMBS delinquencies increased 12 basis points to 4.51% over Q4 with Office delinquencies up to 5.82%. There was a small decline in December which will be tracked closely. According to Moody’s Analytics, the US national office vacancy hit 19.6% in the fourth quarter, the highest level since 1979 suggesting that despite the fall in interest rates, the sector is still facing strong headwinds.
The fundamental story is marginally better in Australia though moving in a similar direction. Office vacancy rates continue to increase, showing no signs of stabilisation though again the reduction in long term interest rates should alleviate some of the upward pressure on cap rates.
Taking a closer look at Sydney CBD Office, analysis by UBS shows prime effective rents still well down on 2019 levels at around $800/sqm and vacancy rates at 12%, up from just under 3% in 2019. Market yields are only up 80 basis points versus a 3% increase in long term interest rates. Colliers estimates that there may be another 15% in declines for Sydney office to take the peak to trough decline to around 25%.
Looking at the listed equity markets sector, Dexus has seen a strong rally due to declining bond yields yet even with this, Dexus still trades at a price to book of less than 70% and trades with a dividend yield of 7% while its long term bonds trade at around 6.5% yield to maturity.
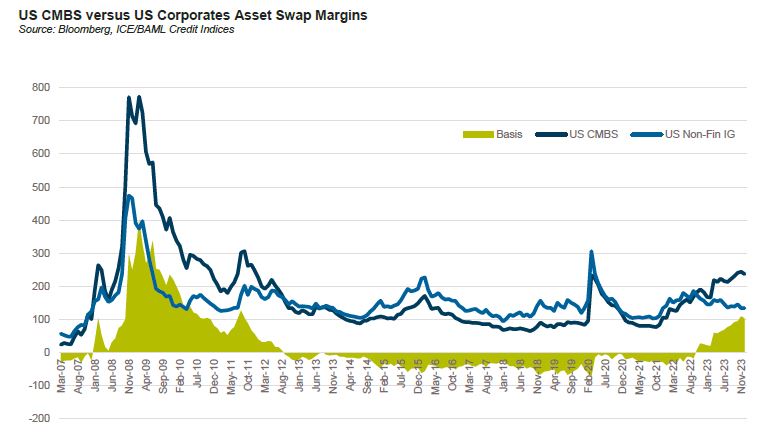
Offshore CMBS pricing remains wide relative to corporates. CMBS pricing is actually pricing at the widest levels to corporates since the global financial crisis, reflecting the significant pressure still facing the sector.