
Market Review & Outlook:
Non-Financial Credit:
Summary views: High yields but tight spreads. Weaker fundamentals may start to weigh on performance. Still favouring private markets despite ongoing questions around governance and valuations.
Spread performance was mixed over the quarter. The post Liberation Day volatility which saw spreads widen sharply in April is a distant memory with most markets we track fully retracing the move before quarter end. In Australia credit spreads have lagged offshore markets and globally high yield has outperformed investment grade. While generally tighter than March levels, spreads are still wide of the tights of early 2025.
Over a longer time horizon, spreads are still roughly 1.5 times the post GFC tight levels with the exception of US high yield and leveraged loan markets which are only 1.1 times the post GFC-tights hit in January of 2025. Commercial real estate markets, typically a higher beta sector, has outperformed with spreads for European real estate borrowers at the tightest levels since 2022 and only trading 20 basis points wider than non-financial corporates.
Asset Swap Margins Across Key Markets
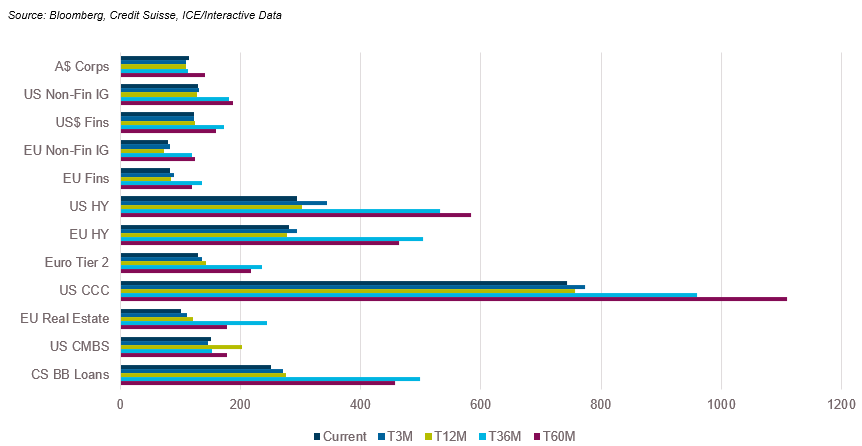
Stressed credits have also performed well with CCC spreads inside of March levels yet still wide of the tight levels of early 2025. This has occurred despite signs of slower growth ahead in 2025 with U.S. speculative grade default rates forecast by S&P to only decline to 4% in March 2026 from 4.3% today and Fitch forecasting US high yield bond and leveraged loan default rates to rise to 4-4.5% and 5.5-6%, respectively, in 2025.
Spreads have arguably performed so well because yields remain elevated. Yields on US investment grade credit have hovered in the low to mid 5% area, below a peak of 6.45% reached in late 2023 but well above 10 year averages of below 4% per annum. US high yield is trading with 7-handle yield, in line with historical averages, perhaps suggesting that spreads may have run their course there.
Downgrade ratios increased sharply in the second quarter and currently sit at the highest levels of the past 12 months. Downgrades were dominated by speculative grade credits with over 80% of all downgrades coming from speculative grades. Much of the downgrade pressure has been felt by the most tariff affected sectors with consumer products businesses facing the most negative net ratings actions.
Spreads in high yield markets may also have been constrained by a lack of net issuance. Within leveraged loan markets, approximately 40% of loans were trading above par at the end of June with refinancing activity dominating primary issuance. JPMorgan forecasts full year 2025 net issuance of high yield and institutional loan net issuance declining 8% and 12% year on year declines.
Add to this relative valuations. In the United States, high yield bond yields are more than 3% higher than the earnings yields on equities, well above historical averages. In Australia the gross earnings yield on the ASX is less than 5%, roughly flat to investment grade corporate yields.
Within private lending markets activity levels have picked up but increasingly are competing directly with public markets. According to Bloomberg, Finastra, which completed one of the largest ever private credit transactions in 2023, borrowing US$5.3 billion, is seeking to borrow US$3.6 billion equivalent in public markets underwritten by banks including Morgan Stanley, HSBC and JPMorgan.
Credit metrics have showed some signs of deterioration over the quarter as well. This tended to be concentrated in high yield borrowers where according to JPMorgan leverage increased to a 3 year high with coverage moving lower despite interest rates declining.
According to Fitch, the US Private Credit Default Rate (PCDR) was 4.6% through end of May on a trailing 12 month basis, in line with the 4.6% in December 2024. In May, Fitch reported that 17% of borrowers in their Privately Monitored Rating (PMR) portfolio had an interest coverage ratio of less than 1 times, up from 7% in Q124. Fitch’s index of Business Development Companies says deferrable obligations hit a peak of 8.1% of portfolio balance in March 2025 with defaulted and deferring obligations declining to 0.74%.
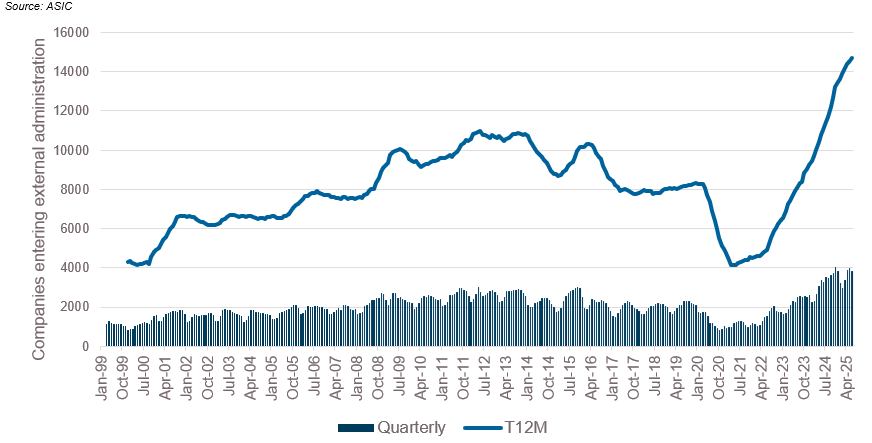
US corporate bankruptcies at 371 through June was up about 11% from 335 in the year earlier period. That volume is the highest for the first year since 2010. This same trend has been observed domestically where insolvencies are at all time highs and are exceeding pre-COVID trends and still tracking at around 4,000/quarter.
Companies Entering External Administration
The absence of realized losses within the private credit market led to many (though not all) listed invested trusts trading at flat to small premiums over their net tangible asset values. There was a successful new listing in the quarter and several existing private credit LITs were able to complete new placements taking total market capitalization over A$8 billion. This is despite continued reporting of ongoing investigations, funds suspending redemptions and ongoing credit stresses within private lending portfolios.
Financial Credit:
Summary views: subordinated financials are tight but cheap to other parts of the capital stack and unlikely to widen given lack of supply
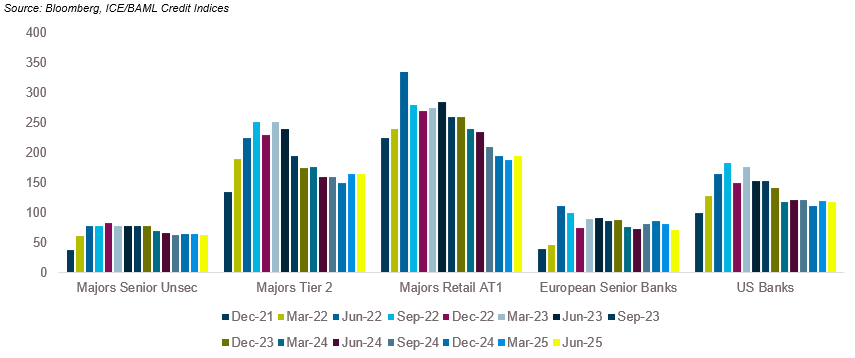
Senior financials continued to grind tighter over the quarter across Australia and Europe with spreads hitting the tightest levels since early 2022. Subordinated financials tracked moves in broader credit markets by widening early in the quarter and then retracing that move ending the quarter flat, though still slightly wide to where they started the year. Domestically the basis between Additional Tier 1 securities and Tier 2 securities seems to have found a level at around 30 basis points.
Bank Spreads
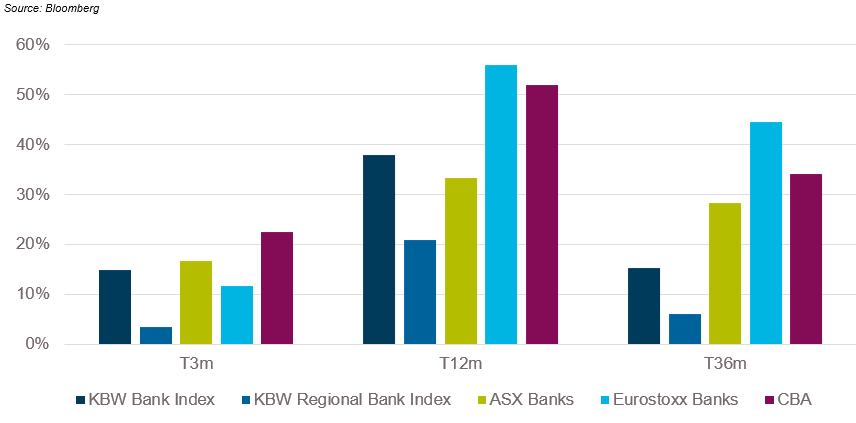
The performance of bank credit contrasts with bank equity which has performed exceptionally strongly. Much of the strength domestically has been fuelled by CBA which ended the quarter trading at 30 times estimated earnings. The only comparable performance in recent years has come from European banks which had a 50% return in the 12 months to 30 June although the starting point was very different. Even today, European banks only trade at around 9 times earnings.
While financial credit appears expensive in historical credit spread terms, a five year CBA tier 2 security is currently trading at a yield of circa 5% per annum, which contrasts with CBA’s grossed up dividend yield of less than 4%.
Bank Equity – CBA vs the Eurostoxx Banks
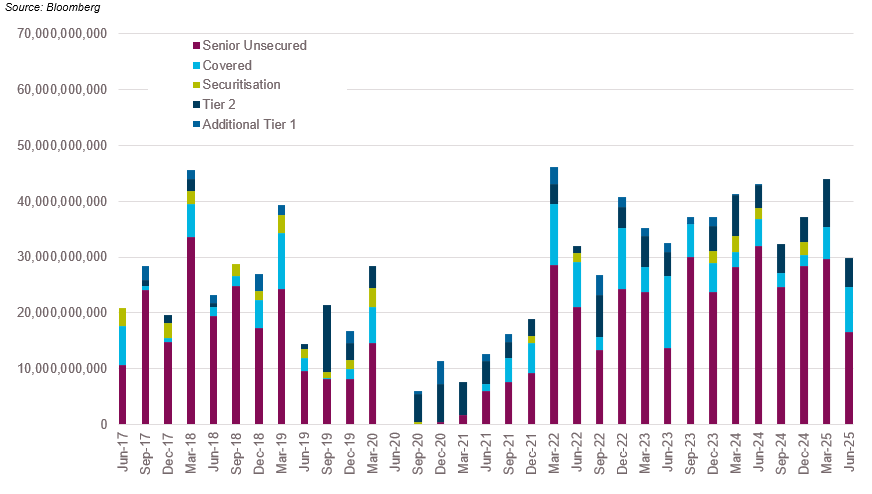
Issuance levels for the banks was slower than previous quarters with only $30 billion in aggregate issuance down from close to $45 billion the year prior. Some of this could be attributable to a funding gap (i.e. loan growth less deposits growth) which is growing at a QoQ rate of c. $4 billion versus $10 billion at the start of the year.
Tier 2 issuance was also down with the major banks well ahead of their funding task even with the phase out of Additional Tier 1 securities. All of the majors have already met APRA’s 2026 with Deutsche Bank estimating flat net issuance for the rest of 2025 and only $2.6 billion in 2026. With $1.7 billion due to be repaid on Westpac’s listed AT1 notes in September plus another $3.05 billion in anticipated calls of major bank AT1s in 2026 there is likely to be excess demand for Tier 2 paper in the near future.
Major Bank Issuance
ABS & Whole Loans:
Summary views: the long rally in domestic securitised markets seems to be waning with spreads struggling to return to pre-Liberation Day tights. More value in sub-investment grade but set against risks of weaker fundamentals
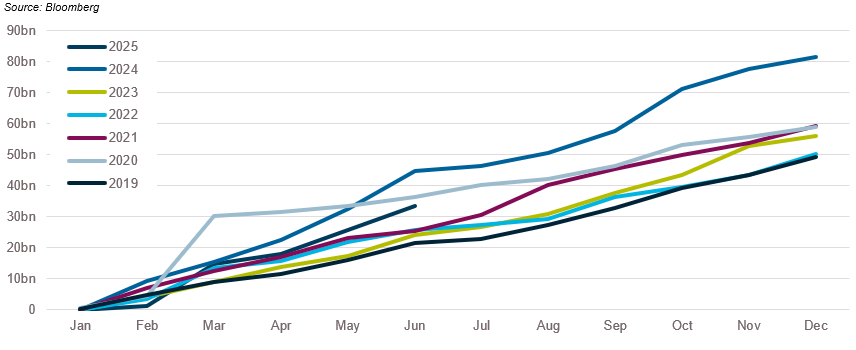
The Australian dollar securitisation market had only the briefest of lulls following Liberation Day volatility with issuance look set to only trail 2024’s record post GFC levels. Non-banks represent 89% of YTD issuance, the highest YTD share on record though this will reduce with ANZ surprising the market by announcing a capital relief transaction in early July.
A$ Securitisation Issuance by Year
Issuance in US ABS markets was also quick to rebound. Barclays predicts that 2025 ABS issuance will be larger than 2024 with US$319 billion issued. In CLO markets, refinance/reset activity is up 43% year on year with heavy levels of activity in middle market CLOs and European CLOs which were up 246% and 150%, respectively on a YoY pcp basis. Primary issuance is down 1% compared to 2024, slowed by lack of new loan production.
One part of the CLO market experiencing significant growth is ETFs investing in broadly syndicated CLOs. Assets under management for CLO ETFs are US$31.6 billion, up 134% on a year on year basis and now representing 2.8% of the US CLO market size. While this may sound small, during the volatility of April, investors withdrew a combined US$1.7 billion from CLO ETFs in a single week which temporarily impacted spreads on new issues.
Delinquency levels continued to drift higher over the quarter. The S&P Prime SPIN index was higher at 0.97%, a 0.08% increase (March 2025 month end) but is lower than 12 months ago while the non-conforming equivalent was higher at 4.39%, 0.2% higher than March 2024. Auto 30+ delinquencies were 1.64% at March 2025, fairly flat over the past 12 months but up around 0.5% from mid-2023. Offshore the upward trend in delinquencies is much clearer. EMEA Auto 30+ delinquencies hit 1.14%, up 0.07% over the past 12 months with annualised losses at around 0.5%. According to Fitch, US subprime auto loan 60+ delinquencies are comfortably above 6% for the first time on record, including the GFC when they only just reached 5%.
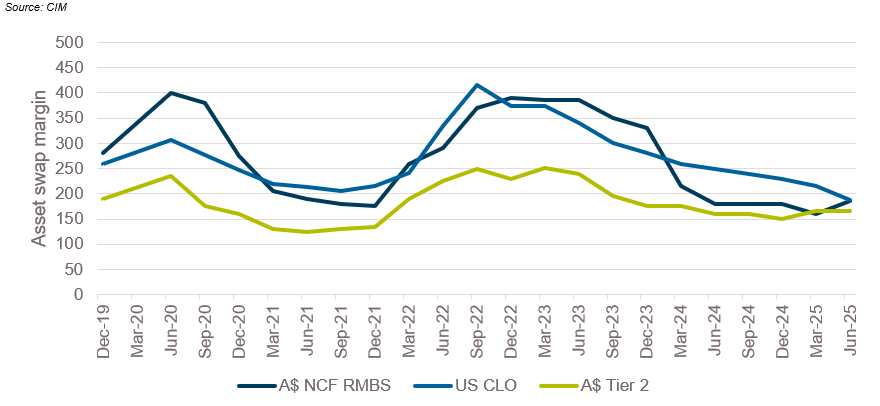
Pricing moves on a quarter-on-quarter basis showed mezzanine spreads on domestic ABS exhibiting signs of fatigue. Single A-rated non-conforming spreads were approximately 0.25% wider while Tier sub debt was flat over the quarter and CLO spreads rallied inside of 200 basis points in spread terms. It was a similar story with sub-investment grade tranches with CLOs tightening and A$ RMBS widening.
Securitised Pricing: signs of fatigue in A$ RMBS
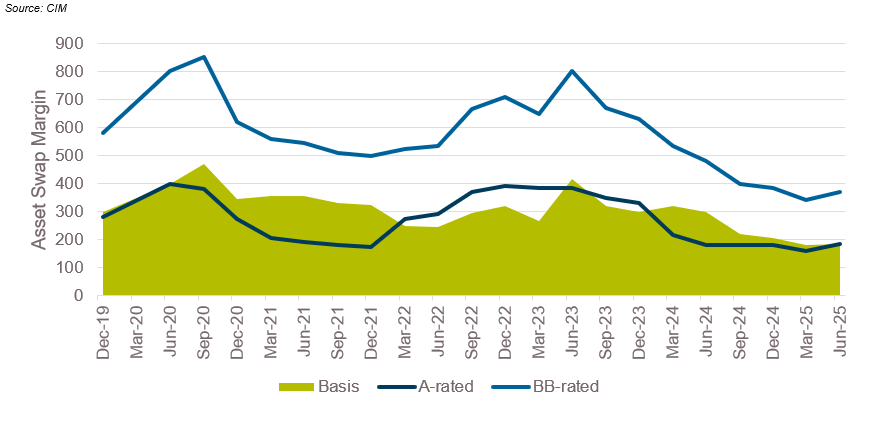
Pricing in A$ sub-investment grade looks okay relative to investment grade with around a 200 basis between A-rated and BB rated. This is tight by historical measures but not materially so.
Securitised Pricing: Sub-investment grade tranches are tight but still offer a decent pickup to IG
Real Estate Loans:
Summary views: Mixed fundamental signs but lender risk appetite is returning as interest rates decline.
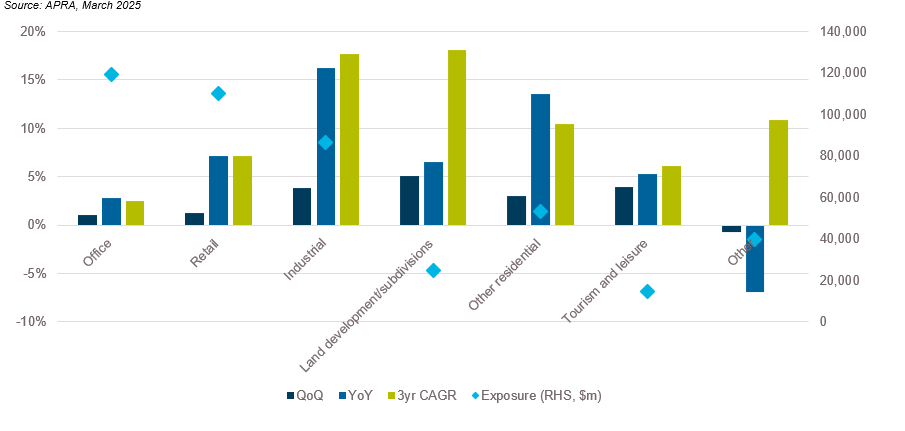
Bank exposure to commercial real estate grew 1.7% in the March quarter. Year on year growth in exposures was around 7%, still slower than the 3-year annualised growth rate of around 9% but picking up as signs of a bottoming in asset values seem to be helping risk appetite.
The strongest growth came in land development/subdivisions which were up 5.1% for the quarter but only 6.5% on a year over year basis. This growth came in the quarter where APRA clarified its guidance from March of 2017 to say they didn’t stipulate that banks must have presale coverage equivalent to at least 100% of committed debt but would rather reference industry practice at the time.
Australian Bank Commercial Real Estate Lending Exposures
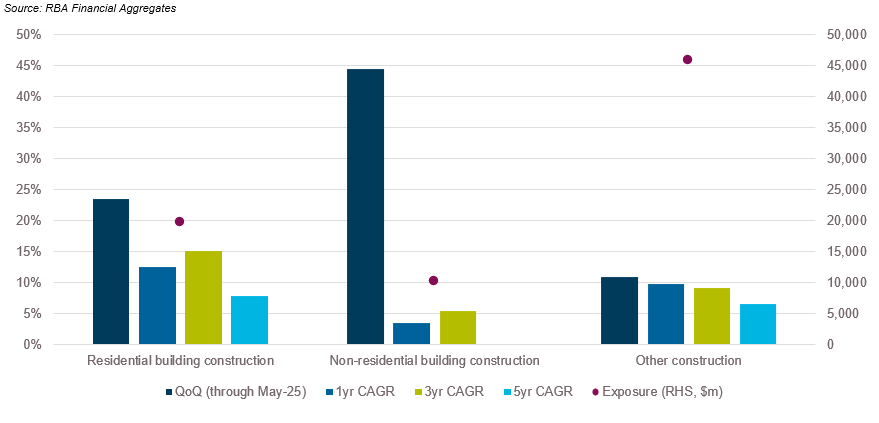
Perhaps reflecting the APRA news mentioned above, RBA data showed that through May residential construction lending growth had picked up sharply, up 23.5% over the quarter and 12.5% over the past 12 months. Other construction was up a still strong 10.9% for the quarter, representing all the growth on a trailing 12-month basis.
Construction Loans
Asset quality of CRE loans continues to be an area of focus but has shown resiliency with March quarter delinquency rate for larger banks in the United States (ranked 1-100 in size) declining for the first time since 2022. Despite this, delinquency rates for small banks continue to increase and delinquency rates in CMBS also went up, hitting 7.13% in June 2025. Office loans had stabilised in the March quarter but delinquencies returned back above 10% in April and moved above 11% in June for the first time on record.
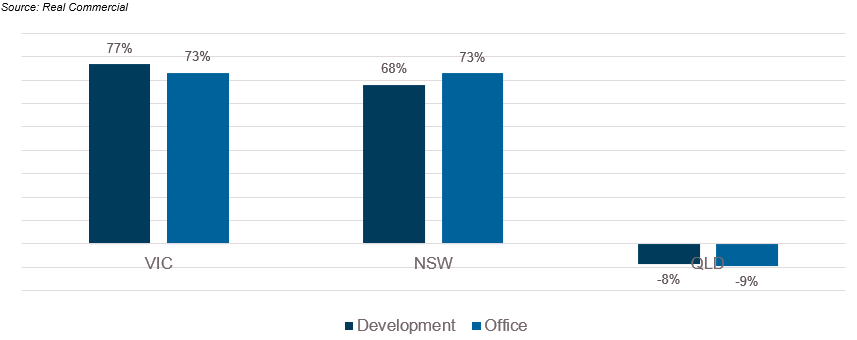
As we discussed last quarter, over the past two years there has been a strong uptick in the available stock of sites for sale particularly across NSW and Victoria. Since the lows in 2022, stock available for sale in NSW and Victoria is up sharply and this figure continues to grow. In Victoria, development sites for sale are up 10% in the first half of the year.
Change in Stock for Sale (Q422-Q225)
CBRE conducted a lender survey in the June quarter which revealed some relaxation in lending terms. Flexibility around interest coverage with around half of all lenders requiring 1.35x with the remainder at 1.5x. There was a sharp uptick in LVR risk with c. 55% of lenders willing to tolerate an LVR of 60% or higher, up from only 40% in H224. Presale requirements declined as well with almost 70% of lenders okay with 0-50% presale coverage requirements versus 50% in H224.
While there are still problem assets yet to be resolved and cautiousness amongst investors, evidenced by a well-regarded manager being forced to suspend redemptions on a billion dollar fund, risk appetite seems to be increasing from lenders with more competition driving pricing and terms lower.
On behalf of the team, thanks for reading.
Pete Robinson
Head of Investment Strategy – Fixed Income | +61 2 9994 7080 | probinson@challenger.com.au
For further information, please contact:
Linda Mead | Senior Institutional Business Development Manager | T +61 2 9994 7867 | M +61 417 675 289 | lmead@challenger.com.au | www.challengerim.com.au
Disclaimer: The information contained in this publication has been prepared solely for solely for the addressee. The information has been prepared on the basis that the Client is a wholesale client within the meaning of the Corporations Act 2001 (Cth), is general in nature and is not intended to constitute advice or a securities recommendation. It should be regarded as general information only rather than advice. Because of that, the Client should, before acting on any such information, consider its appropriateness, having regard to the Client’s objectives, financial situation and needs. Any information provided or conclusions made in this report, whether express or implied, do not take into account the investment objectives, financial situation and particular needs of the Client. Past performance is not a guide to future performance. Neither Fidante Partners Limited ABN 94 002 895 592 AFSL 234 668 (Fidante Partners) nor any other person guarantees the repayment of capital or any particular rate of return of the Client portfolio. Except to the extent prohibited by statute, Fidante Partners or any director, officer, employee or agent of Fidante Partners, do not accept any liability (whether in negligence or otherwise) for any errors or omissions contained in this report.