

Market Review & Outlook:
Non-Financial Credit
Easing geopolitical concerns led to tightening of credit spreads. However, we remain cautious as dispersion persists, particularly as investors digest shifting interest rate expectations.
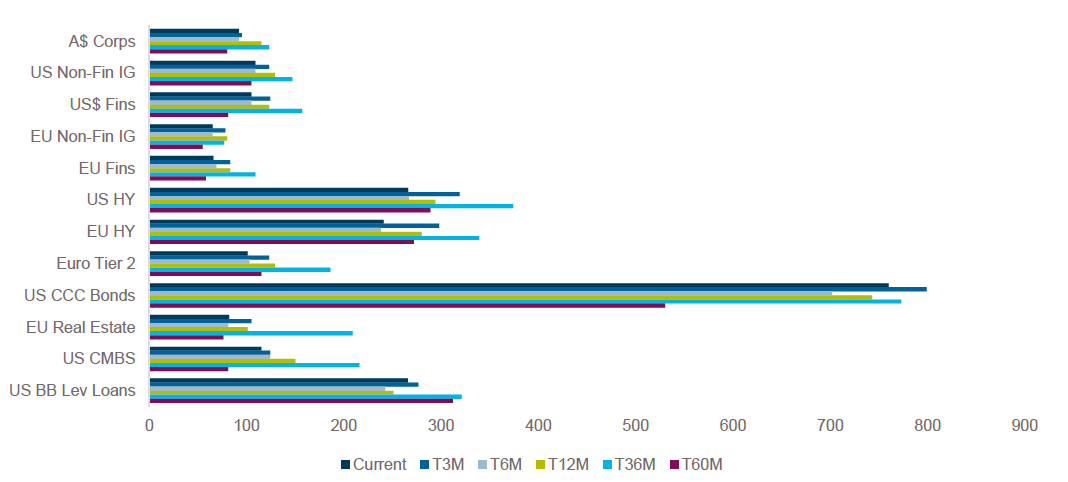
Over the quarter, credit spreads tightened across all sectors, with most sectors essentially reversing the initial widening at the onset of the US-Iran conflict. This was driven by the signing of a Memorandum of Understanding between the US and Iran, the reopening of the Strait of Hormuz, lower oil prices, resilient credit fundamentals and robust investor demand. However, dispersion remains, particularly after Kevin Warsh’s appointment as Fed Chair with markets viewing his first statement in June as a hawkish pivot.
The reversal in spreads brings the high yield bond sector back to historically tight levels, ~5th percentile since 2007. In contrast, CCC-rated credits tightened by 39bps, only partially retracing the 97bp of spread widening at the end of Q1 2026 and continue to trade at ~45th percentile. This highlights the divergence in performance in the lower-rated part of the high yield market, particularly as lower rated borrowers may be exposed to a higher for longer interest rate environment.
Nevertheless, the retracement in spreads over the quarter is somewhat surprising. Oil flows are still below pre-war levels and oil prices have been supported by strong levels of strategic reserves. Reserves have also been drawn down significantly, as well as increased exports from the US and demand destruction from China. This highlights the strong technical demand for credit but also underscores the potential risk of spreads moving wider, particularly if the US and Iran are unable to come to an agreement and there is a renewal in the conflict.
Asset Swap margins Across Key Markets
Despite the broader macro volatility over the quarter, the new issue market of US leveraged loans was resilient, aided by a pickup in activity from corporates (non PE-sponsored). PE-sponsored non-refinance deal volume was down 52% QoQ, to US$137bn. This was the second-lowest reading in over 8yrs with the lowest during the COVID-19 pandemic in Q2 2020. Sponsors focused on refinancing, extensions and repricings over putting new capital to work. Corporates (non PE-sponsored) helped to fill the gap, such that Q2 US leveraged loan activity was only down 9% vs Q1. Expectations for a pickup in buyout and M&A deal activity hasn’t materialised with YTD (to 24 June) tracking closely to volumes seen in 2025 for the same period. Only ~28% of primary market activity has been unrelated to refinancing activity, maturity extensions or transaction repricing. For both PE-sponsored and corporate borrowers, the largest share of Q2 activity was repricings as borrowers looked to take advantage of a repricing window in May after a 3-month break.
Domestically, market conditions remain broadly supportive for borrowers during the quarter, though lender selectivity has increased. Borrowers with strong credits are benefitting from the strong uptake of their debt, while cyclical or structurally challenged sectors face more challenges, with transactions taking longer to complete. Similar to US, PE sponsors continue to undertake refinancings and recapitalisations on existing portfolio assets, with healthy support from underwriting banks.
Rating actions across offshore corporate credit markets improved in Q2. Corporate earnings were strong over the quarter, beating estimates on average with strong aggregate earnings growth for the S&P 500 at 28.7% for the quarter ending on 15 May 2026. In addition to this, the resilient US economy has resulted in credit ratings improving in the US investment grade market with US$227bn of debt upgraded vs US$49bn downgraded, resulting in net upgrades of US$179bn, the most since Q1 2024. In the leveraged loan market the LTM upgrade-to-downgrade ratio was skewed to the downside at 0.84. However, this represents an improvement to last quarter from 0.75. Revenues and EBITDA expanded at the highest and second highest rates in 3+ years to Q1 2026 with coverage and leverage metrics improving. However, bifurcation remains a theme in loan markets, where software loans saw some pullback following a similar selloff in AI-related stocks, after initially seeing some recovery over the quarter. YTD returns for the JPM Leveraged Loan Index is 1.46% including Software vs 2.42% excluding Software.
Financial Credit
Consistent with last quarter, constructive on Financials particularly G-SIBs although asset quality trends are one to watch. While issuance volumes have been strong, second half is less certain given tightening lending conditions and changes to negative gearing and CGT may dampen lending volumes.
Similar to non-financial credit, financials also reversed the spread widening in Q1, with Europe generally outperforming at 3bps tighter YTD vs flat for US financials. US Financials faced some ongoing scrutiny around private-credit structures, BDC redemptions activity and concerns around software sector exposure within private credit portfolios. Funding conditions in the AUD market remained constructive for the Big 4 domestic banks over the quarter. After 5yr senior unsecured spreads had widened marginally from 74bps in January to 77bps at the peak volatility in March, trading levels tightened in to ~63bps at the end of the quarter. While funding has been constructive for the major banks, investors are becoming increasingly focused on asset quality in banks post the profit warning from Judo after they had identified significant credit deterioration in three SME loan exposures. This resulted in their share price falling by >40% in June.
APRA has been continuing their consultation on corporate risk weighted assessments and over the quarter started consultation on credit risk weights for selected corporate loans, where key proposals included: 1) lower risk weights for large domestic public infrastructure exposures, 2) a lower risk weight for high-quality unrated corporate exposures, and 3) allowing greater exposures to qualify for the lower 100% risk weight for residential property development. These proposals could result in increased lending to these segments, with greater benefit for smaller ADIs as major banks predominantly assess their corporate credit RWA using the IRB approach.
Bank Spreads
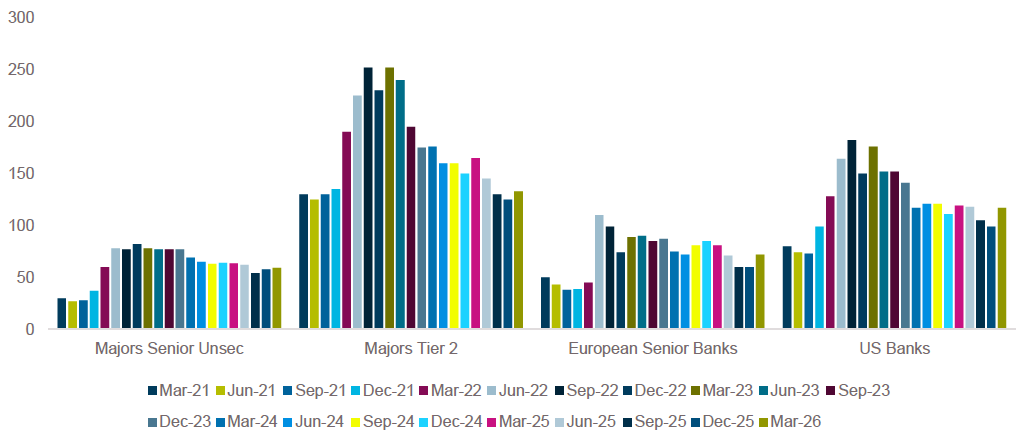
Issuance has been robust to end the first half of the year with the AUD market closing H1 2026 with A$72.9bn of financial supply YTD (vs A$53.7bn for 2025), with growth seen across most segments. However, second half issuance is less certain. While deposit growth is strong, higher interest rates and inflation have tightened borrowing capacity. Investor loan growth has been slowing as a result of the proposed changes to negative gearing and CGT post the Federal Budget.
Australian Bank Lending Exposures by Sector
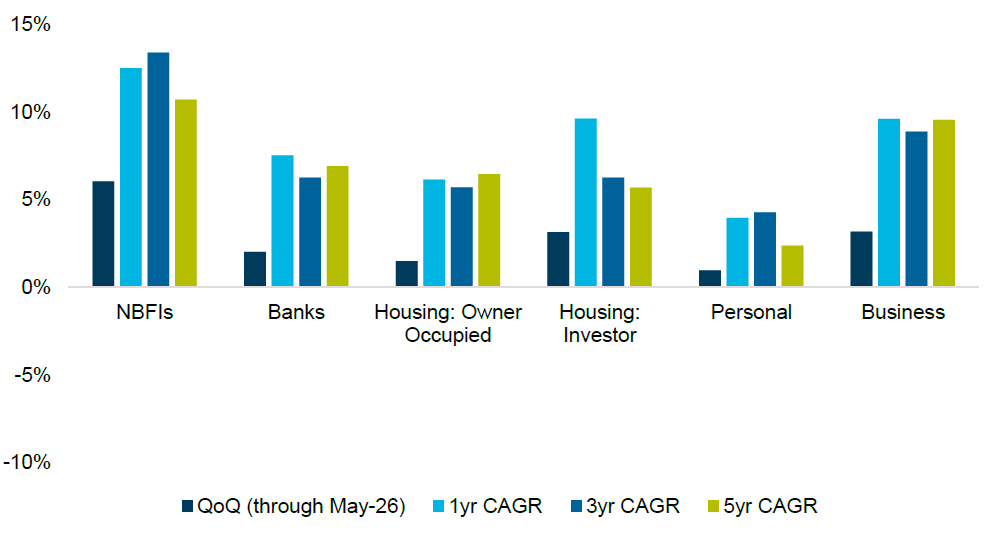
Source: APRA
Securitised Credit
Spreads retraced Q1 widening despite heavy issuance volumes, with the exception of GBP ABS and increasing investor selectiveness with tiering between manager and pools. Dispersion in performance between deals highlights the need for greater discipline when it comes to credit selection.
The Australian dollar securitisation market continued the strong issuance trend in Q2 seeing similar issuance volumes in Q1 with another ~A$22bn of issuance. Like corporate credit markets, Australian securitised credit spreads started to reverse the widening spread trend and tightened over the month, with senior spreads ~2-8bps tighter, although remains ~5-15 wider than the start of the year.
Similar to Australia, 1H gross issuance volumes were also strong for European ABS (incl EUR CLOs) at €93bn vs 1H25 volumes of €76bn, a 22% increase. This was largely driven by the increase in ABS and RMBS, while CLOs and CMBS has been broadly flat (although we note that EUR CLOs saw record issuance levels in 2025).
Within ABS, there has been a heavy supply of GBP ABS issuance with £5.4bn YTD, the highest 1H for any post-GFC period. This has resulted in a divergence between European ABS spreads where there were potentially signs of investor fatigue as UK senior spreads continued to widen slightly by ~3bps, while European senior spreads reversed the Q1 spread widening and tightened by ~1-5bps.
Issuance in CLO markets has also been heavy in 1H with US$284bn vs US$298bn for 1H 2025 and similarly skewed to refinance/reset transactions with similar volumes at US$167bn vs US$170bn for 1H 2025. Despite the heavy issuance, CLO spreads tightened over the quarter and are now through YTD tights as senior spreads tightened by ~5bps and mezz IG spreads tightened by ~10-50bps.
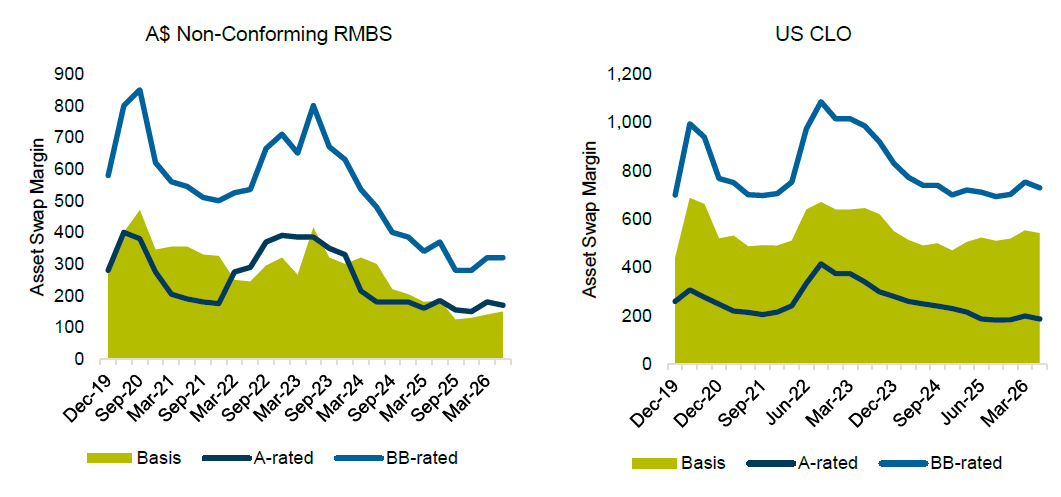
The A-BB basis widened over the quarter in A$ NC RMBS markets, while the US CLO A-BB basis tightened. However, dispersion persists in CLO markets with tiering observed for managers and pool quality, particularly in the lower parts of the capital structure. For example, spread basis of >100bps could be observed for the BBB tranche between new issue deals from tier 1 and lower tier managers, where the tiering could have been more pronounced due to a recent default observed in a sub-IG bond from a CLO managed by Bain.
Securitised Pricing
Over the period, the RBA delivered another rate hike in May and held steady in June, although with a hawkish tilt, after having made two consecutive rate hikes in Q1. The flow on impact from these rate hikes on household real incomes and securitisation collateral performance is yet to be seen. Thus far, Australian ABS and RMBS collateral performance has remained broadly stable with the S&P Australian Non-Conforming SPIN index showing a decrease in 30+ delinquencies from 3.90% as of Feb-26 to 3.45% as of May-26. In comparison, the Australian Auto ABS SPIN index was broadly unchanged at 1.32% over the same period. In Europe collateral performance has stabilised across most sectors; particularly evident in those with floating rate mortgage markets such as Spain and Italy, for example. Where some pockets of deterioration have been seen, overall, we expect ABS structures to remain robust although the prosect of some ratings downgrades remains if transactions continue to perform outside of rating agency assumptions.
Real Estate Loans
Construction activity has been robust driven by pickup in building approvals. Uncertainty persists in the construction sector due to higher interest rate environment, higher construction costs and significant reforms to CGT and negative gearing introduced by the budget.
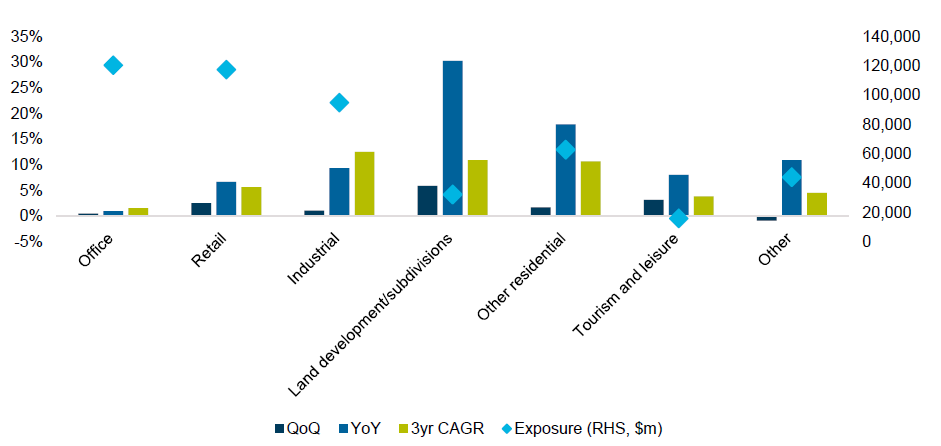
Bank exposure to commercial real estate grew 1.6% in the March quarter. Year on year growth in exposures was 8.7%, above the 3-year annualised growth rate of 6.5%. Tourism & leisure showed good growth at 3.2% QoQ while land development/subdivisions saw a deceleration with 5.9% QoQ growth versus 30.2% YoY.
Australian Bank Commercial Real Estate Lending Exposures
Source: APRA
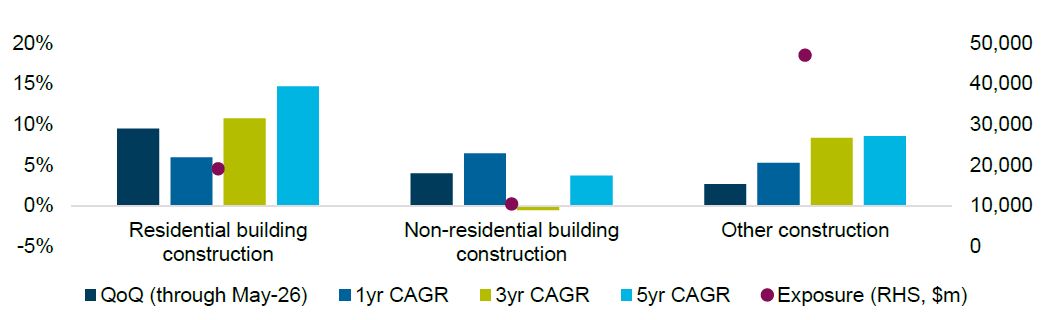
RBA data showed a pickup in residential construction lending growth, up 9.5% vs 1yr growth of 5.9%, reversing the slowdown in the prior quarter. The pickup in residential construction lending may have been driven by the increase in dwelling approvals with total dwelling units approved up 8.8% y-o-y to May 26, with government housing initiatives to build 1.2m new homes over 5 years to June 2029. Non-residential activity has also been elevated at 3.9% for the quarter and 6.4% for the year vs 3.7% over 5 years, with some segments such as data centres growing rapidly.
Construction Loans
Source: RBA Financial Aggregates
Looking forward, uncertainty exists particularly in the construction sector due to higher interest rate environment, significant reforms to negative gearing and CGT during the budget announcement in May. There are also higher construction costs associated with the Middle East conflict, which may challenge the feasibility of some construction projects moving forwards if these conditions are to persist. Anecdotally, there are signs of bank lending entrenchment, with the elevated interest rate environment putting pressure on ICR covenants and valuations, in turn putting pressure on LVRs. Some borrowers are seeing banks less supportive or not looking to take on more exposure. Similar to corporates, acquisition finance has also slowed down materially as real estate PE companies struggle to triangulate value and do deals.
On behalf of the team, thanks for reading.
Disclaimer: The information contained in this publication has been prepared solely for the addressee. The information has been prepared on the basis that the Client is a wholesale client within the meaning of the Corporations Act 2001 (Cth), is general in nature and is not intended to constitute advice or a securities recommendation. It should be regarded as general information only rather than advice. Because of that, the Client should, before acting on any such information, consider its appropriateness, having regard to the Client’s objectives, financial situation and needs. Any information provided or conclusions made in this report, whether express or implied, do not take into account the investment objectives, financial situation and particular needs of the Client. Past performance is not a guide to future performance. Neither Fidante Partners Limited ABN 94 002 895 592 AFSL 234 668 (Fidante Partners) nor any other person guarantees the repayment of capital or any particular rate of return of the Client portfolio. Except to the extent prohibited by statute, Fidante Partners or any director, officer, employee or agent of Fidante Partners, do not accept any liability (whether in negligence or otherwise) for any errors or omissions contained in this report.