
Market Review & Outlook:
Note: Market volatility has been at extreme levels in early April. The VIX volatility index hit an intraday level of 60, the highest level since March 2020 and US high yield credit spreads which had reached post GFC lows in January, widened by close to 200 basis points. Most concerning was the bear steepening in the US yield curve with the 2s10s curve increasing by 35 basis points over a single day.
As we write this piece, equity markets have staged the biggest single day rally since the GFC, rising 9.58% on the back of the hope that the “Trump put” is still alive. However, the optimism could be short-lived. The longer term effects of prolonged uncertainty around tariffs will eventually hit fundamentals and weigh on markets. We may well be in the eye of the storm.
Comments from here will focus on moves in markets through to March month end. We appreciate that some of our observations be redundant by the time you read them but equally some context as to where we were before the volatility picked up is relevant as is the discussion around relative valuations.
Non-Financial Credit:
Summary views: Despite stable fundamentals, the economy is slowing. The move wider in spreads is from very tight levels. Public investment grade assets appear the best value at the moment though we expect private markets to follow public markets wider on a lagged basis.
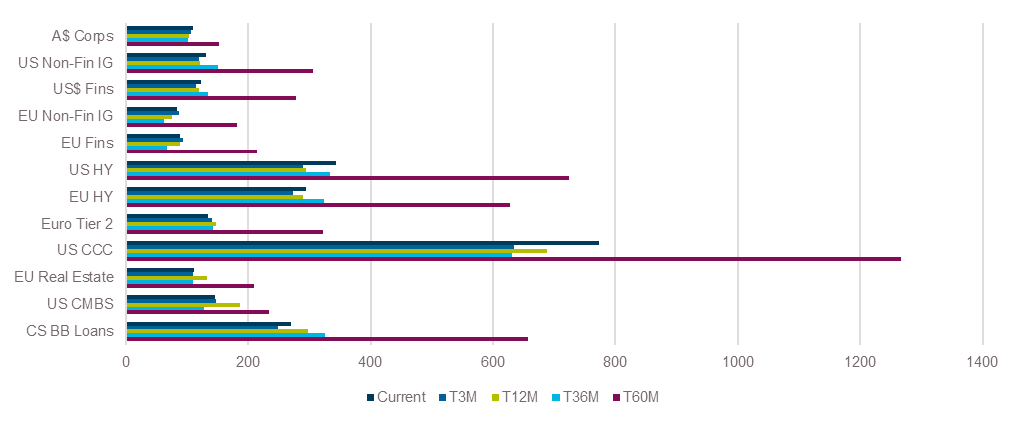
The post Trump euphoria appeared to peak in Q1. US High yield credit spreads traded below 260 basis points in January, the tightest level since June 2007, before widening in March ending the quarter 54 basis points wider at 344 basis points. The move retraces all of the spread tightening of 2024 taking spreads back to late 2023 levels. The moves were most pronounced in bonds with leveraged loans outperforming.
Moves in higher grade markets were more muted but this is at least partly due to the fact that valuations were not nearly as extreme prior to the move wider. US investment grade spreads are trading at 90% of the 2011-2019 average spread level, cheap versus high yield which is at 80% of the 2011-2019 average spread. By this metric the cheapest and most expensive credit assets we track are US CMBS which is trading at 116% and European subordinated financials which is trading at 61% of the 2011-2019 average.
Asset Swap Margins Across Key Markets
Source: Bloomberg, Credit Suisse, ICE/Interactive Data
Real time indicators of credit spreads in private markets tend to be more lagged. Due to tightness of public markets illiquidity premiums expanded to 2.1% in the final quarter of 2024, the widest level since late Q423. With public markets widening by over 50 basis points during the quarter and more subsequent to quarter end, illiquidity premiums have likely contracted in the near term.
The volatility in asset prices has pushed flows negative, especially in high yield markets. In early April over 3% of FUM was pulled from pan-European and US high yield funds. When compared to net issuance Goldman Sachs noted that the differential between flows and issuance was greatest in European high yield markets which saw a 4.5% drag. Outflows were much smaller in investment grade markets.
Early reads from first quarter earnings have been mixed. Barclays noted an increased reference to “headwinds” in earnings calls from S&P1500 companies, which was especially prevalent amongst consumer sectors and healthcare. According to Barclays earnings were weakest for non-cyclical names, mixed for financials and despite the references to headwinds mentioned above, strongest for cyclicals. Golub’s private market index which is based on the first two months of each calendar quarter had 3% revenue YoY growth and 2% earnings growth with the consumer sector experiencing an earnings drop of more than 5%. These were the weakest figures since Q121 and Q320, respectively.
According to Fitch, the US Private Credit Default Rate (PCDR) was 5.7% through end of February on a trailing 12 month basis, up from 5% in January with healthcare providers recording the highest default rate at 7.5%. The trailing default rate is notably lower than the default rate in Fitch’s privately monitored ratings universe, which was over 8% in 2024, the highest level since Fitch began tracking statistics back in 2019. In February S&P’s base case scenario had the US and European speculative grade default rate falling from 4.7% to 3.5% and 4.0% to 3.75%, respectively. While the rating agencies haven’t updated their forecasts post Liberation Day, Goldman increased its forecast for the issuer-weighted US high yield and leveraged loan default rates to 5.0% and 8.0%, respectively up from 3.0% and 3.5%.
Prior to the news on tariffs negative ratings bias declined albeit with the proportion of stressed issuers remaining stable but elevated. The theme of generally stable fundamentals but with a persistent and elevated tail of stressed borrowers extends to the domestic private credit market where the same corporate borrowers continue to be cited in the mainstream press with relatively few new names experiencing a deteriorating outlook.
Contrasting the move lower in default rates, US corporate bankruptcies at 188 through March were the highest first quarter since 2010 (at 254). This same trend has been observed domestically where insolvencies are at all time highs and almost back to pre-COVID trend. The Reserve Bank of Australia discussed the outlook for insolvencies in the latest Financial Stability Review highlighting that the vast majority (over 80%) of firms entering into insolvency are small with 20 or fewer employees with only around 20% of insolvencies having $1 million or more in unsecured debt.
Financial Credit:
Summary views: subordinated financials moved wider and represent reasonable value relative to asset backed markets. Senior paper arguably still cheap relative to other parts of the bank capital stack such as AT1 and equity.
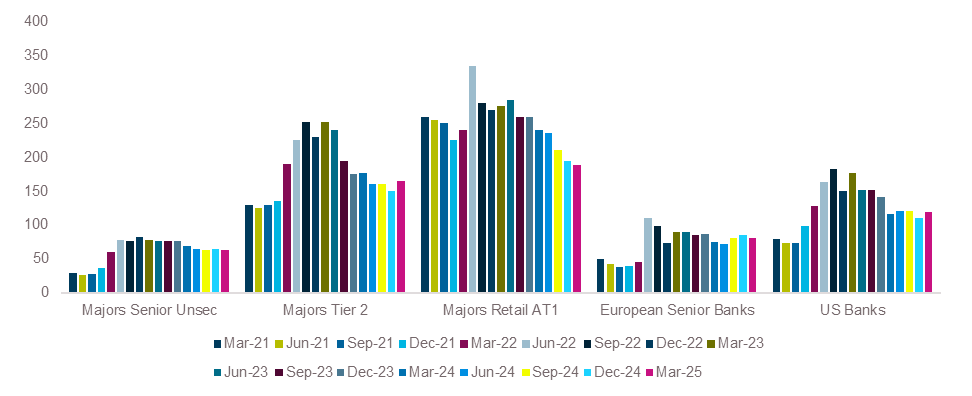
The strong rally in financials abated in the first quarter with tier 2 paper widening by 15 basis points, ending the quarter at levels last hit in mid-2024. Listed Additional Tier 1 securities, a uniquely Australian product which are in the process of being phased out, outperformed the wider market and now only trade around 20 basis points wider than Tier 2 paper, having been at 65 basis points in March 2024. US bank credit spreads widened while European senior banks tightened in local currency terms.
Bank Spreads
Source: Bloomberg, ICE/BAML Credit Indices
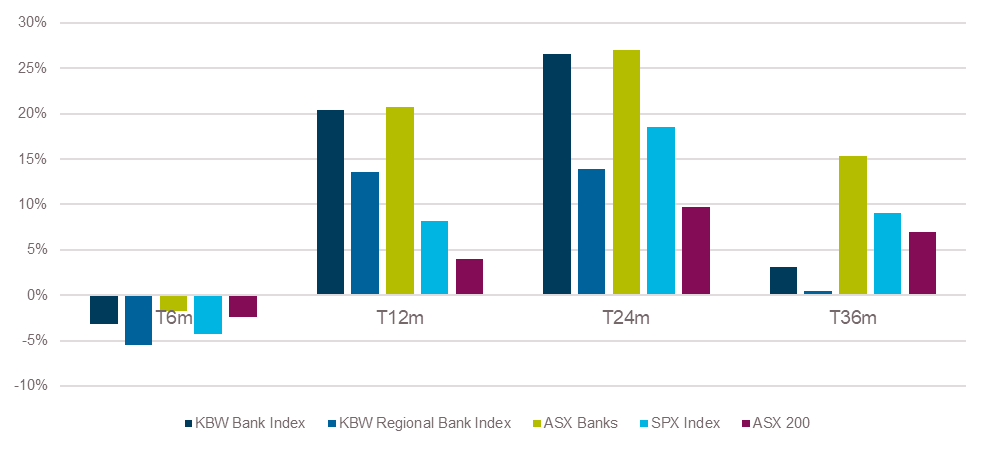
Bank equities sold off over the quarter with the exception of European banks which were up by 28% led by Societe Generale which was up by over 50%. The outperformance is exceptional and driven in part by fiscal spending programs in European pushing up rate expectations and thus profit expectations. Despite the rally, European banks still trade at lower multiples than peers in the US and Europe with JPMorgan seeing them trade at 8.3 times earnings and 1.2 times tangible net assets versus US money centre banks and investment banks at 10.9 and 12.4 times earnings and 1.7 and 2.1 times tangible net assets, respectively.
Australian banks were down over the quarter but outperformed US banks and still look expensive trading at 17 times forecast earnings and 2.2 times tangible net assets. CBA remains the darling of the financial market pricing at 25 times forecast earnings and an astounding 4 times tangible net assets. Financials in Australia represent one third of the ASX200 up 3% over the past 12 months with CBA representing over 10% of the index. Much of the buying of the domestic banks has been fuelled by domestic superannuation funds who hold around 27% of bank equity.
Bank Equity – Australian banks are priced for perfection.
Source: Bloomberg
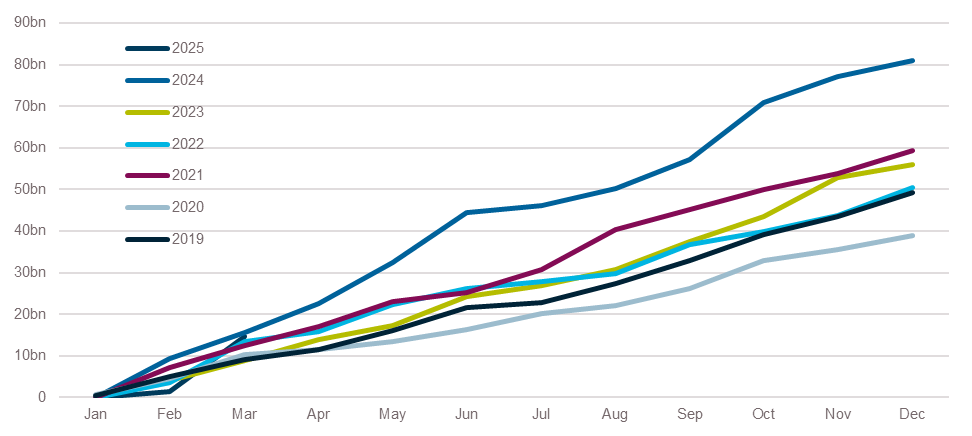
Issuance levels for the banks was strong as the major banks in Australia took advantage of the strong start to the year to issue over $40 billion in debt with a higher than usual proportion tilted towards Tier 2 paper, in part replacing the runoff from maturing/called Additional Tier 1 instruments. Major banks now have over A$115 billion in tier 2 debt outstanding having issued over A$8.5 billion in Q1, the second most active quarter on record.
Major Bank Issuance
Source: Bloomberg

Fundamental performance continued to weaken with tariff related concerns adding to the uncertainty around the outlook. US banks experienced a modest increase in net interest income, benefitting from resetting fixed rate loans to higher base rates and further declines in funding costs. Net chargeoffs were flat over the quarter with allowances at 1.8% of total lending up 0.2%. Domestic data is frustratingly lagged with Q424 the latest data available. Q4 non-performing loans were flat at 1.2% of loans and advances for the major banks and 1.1% for all authorised depositary institutions.
ABS & Whole Loans:
Summary views: relative value favours senior tranches of securitisations. Mezzanine tranches particularly domestically have rallied strongly reflecting strong collateral performance. Private markets continue to grow.
The Australian dollar securitisation market had a strong start to 2025 with first quarter issuance only trailing 2024 which was a record year. Still with volatility emerging it appears likely that issuance will slow from here. Non-bank issuance was 90% of total issuance, above the 2024 average of 70%.
A$ Securitisation Issuance by Year
Source: Bloomberg
As we’ve previously called out, the increase in non-bank issuance is positively correlated with the increase in non-residential mortgage backed collateral being issued and the increase in non-AAA rated paper. Non-RMBS is around 40% of the market with the non-AAA market being around 20% with $18 billion outstanding with quarterly issuance averaging $1-2 billion.
Issuance in US ABS markets was similarly strong with US$88.1 billion issued, only a fraction below Q124 and the third most active quarter of the last five years. The strongest issuance came from autos followed by unsecured consumer loans, equipment loans and data centres. Issuance in non-agency RMBS was slightly up on previous quarters but well below peak levels back when low interest rates drove significant levels of refinancing. CLO issuance at US$48.55 billion was down relative to Q424 which was the peak quarter of issuance over the last five years but still above average levels.
Delinquency levels continued to drift higher over the quarter. The S&P Prime SPIN index was higher at 0.89% (February 2025 month end) but is lower than 12 months ago while the non-conforming equivalent was higher at 4.59%, 0.4% higher than February 2024 and the highest level since mid-2020 though the balance of loans has also shrunk meaningfully as well. Offshore subprime auto loan 30 day delinquencies are in the double digits with 2020 and 2021 vintages the worst performing with delinquencies around 20%. Other sectors are performing better with consumer loans tracking at c. 4% 60+ delinquencies and credit cards at 1.5% though all are trending higher.
Pricing moves through quarter end showed a continuation of previous themes with A$ single A rated securitised pricing rallying to trade roughly flat to major bank Tier 2 paper. Investment grade rated tranches of CLOs also rallied ending the quarter pricing just wide of 200 basis points.
Securitised Pricing: Outperformance by A-rated securitised credit but will it last?
Source: CIM
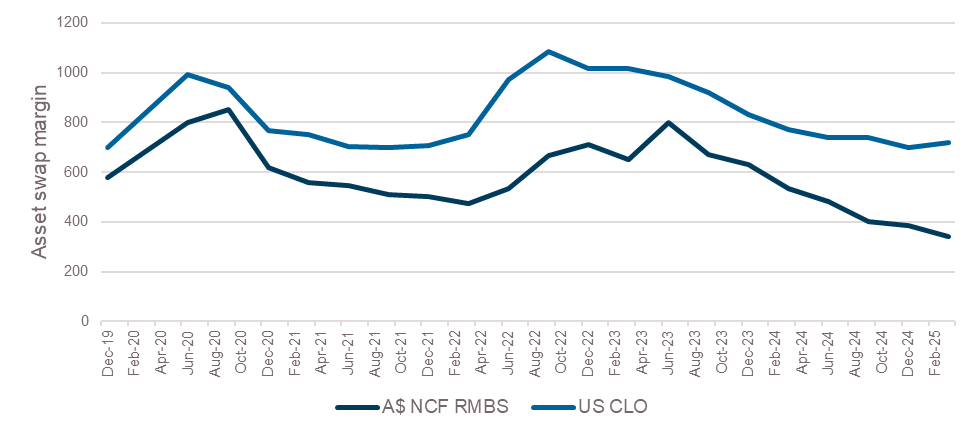
The real action however occurred post quarter end. Within domestic markets we are still very much in price discovery mode direction will come from offshore markets. BB-rated tranches of CLOs are clearing around 70-80 basis points wider than quarter end with investment grade tranches around 30 basis points wider. In European securitised markets secondary activity was elevated in early April with over EUR2 billion on bid lists over the week of 7-11 April which, according to Morgan Stanley, was 4.5 times the weekly average. This had the effect of pushing mezzanine spreads 75-100 basis points wider than the tights though it is unclear how much trading has actually occurred at these levels.
Private market activity was stable leading into quarter end. Strong public issuance and some moderation in non-bank origination volumes has seen warehouse levels stabilise, albeit at very high levels with the major banks holding A$85 billion in senior warehouse exposures even as offshore banks have become increasingly competitive. This has occurred even as bank treasury desks have steadily reduced holdings of public securitised products in the banking book. As at December major banks held less than A$20 billion in exposures down by around a third over a period in which the size of the overall market has more than doubled.
Real Estate Loans:
Summary views: Fundamentals showing signs of stabilising in offshore markets but too early to tell domestically. Competition remains elevated in private markets with the sector still receiving inflows though this may slow given increased scrutiny of the sector
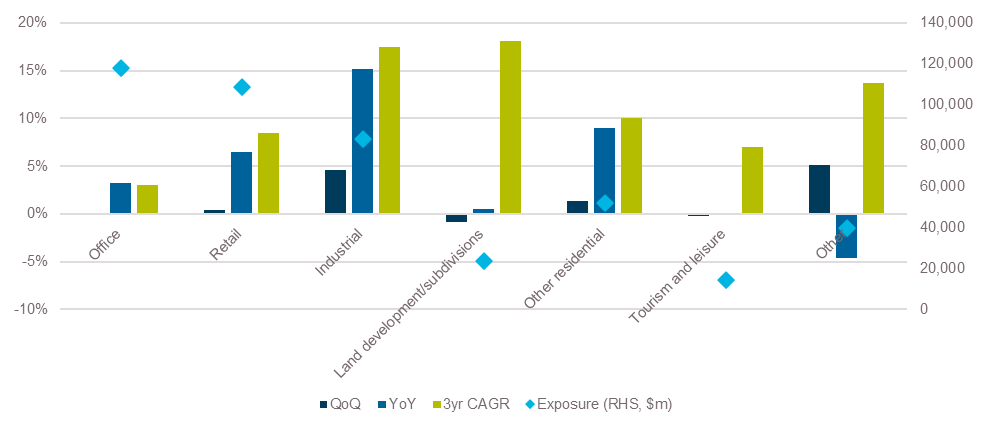
Domestic bank exposure to commercial real estate grew 1.5% in the December quarter. Year on year growth in exposures was around 6%, meaningfully slower than the 3 year annualised growth rate of around 10%.
The strongest growth came in industrial exposures which were up 4.6% for the quarter and over 15% on a year over year basis. The weakest growth came from the ‘Other’ category which was down 4.7% for the year with land development/subdivisions up around 0.5% over the past 12 months and tourism and leisure up only 0.1%.
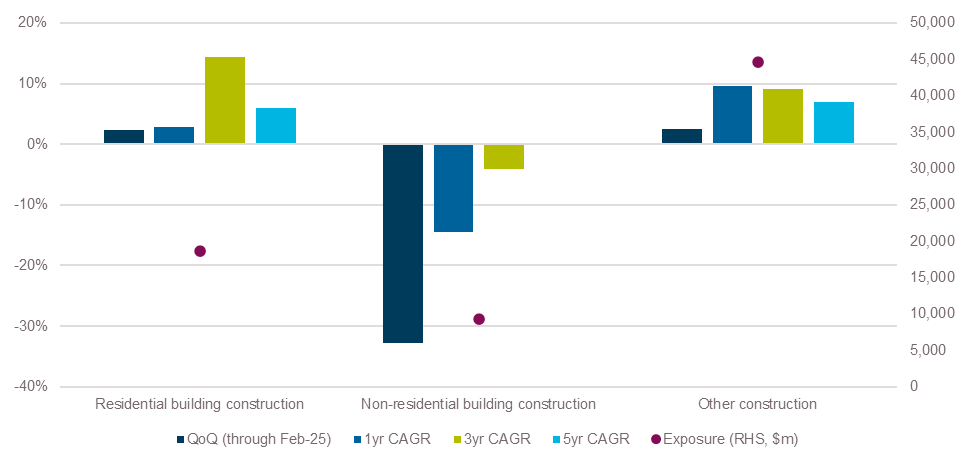
Construction lending, particularly to residential projects continues to attract equal amounts of scrutiny and interest. RBA data showed that through February residential construction lending growth had slowed sharply, up only 2.3% over the quarter and 2.8% over the past 12 months. Other parts of the construction lending market fared even worse with non-residential building construction loans down over 30% in the last quarter alone.
Construction Loans
Source: RBA Financial Aggregates
Asset quality of CRE loans continues to be an area of focus. In the December quarter delinquency rate for larger banks in the United States (ranked 1-100 in size) increased from 1.9% to 1.99%, the highest level since 2013. Delinquency rates in CMBS continue to tick up, hitting 6.65% in March 2025, a 2% YoY increase. Office loans have stabilised with delinquencies back below 10% more than a 1% improvement over the quarter. CMBS pricing was flat over the quarter outperforming high yield and subordinated financials.
In Australia bank exposure to non-performing CRE loans actually improved over the December quarter declining from 0.9% to 0.7%.
As we discussed last quarter, over the past two years there has been a strong uptick in the available stock of sites for sale particularly across NSW and Victoria. This has continued in the first quarter of 2025 with the number of development sites available for sale increasing by 3% in Victoria and close to 6% in NSW. Offices for sale increased by 8% in Victoria and 15% in NSW.
Despite the increased availability of stock, Stamford Capital highlighted that strong competition from non-banks has persisted with the new norm in development markets being leverage up to 90% of cost (75% of value) alongside relaxation of presale requirements. The Property Council of Australia echoed this bullish sentiment with their survey suggest that nationally availability of debt finance would increase by over 10% over the next 12 months, a 5% improvement over December 2024. The fuel is higher capital growth assumptions underpinned by expectations of 50 basis points of reductions in interest rates, ironically considerably less than the expected changes in the RBA cash rate.
Continued regulatory scrutiny on the non-bank lending sector has improved disclosure with more detailed information available though consistent readthroughs to underlying performance are difficult. Despite the availability of stock and continued negative headlines, inflows of capital are helping minimise the impacts of problem assets.
On behalf of the team, thanks for reading.
Pete Robinson
Head of Investment Strategy – Fixed Income | +61 2 9994 7080 | probinson@challenger.com.au
For further information, please contact:
Linda Mead | Senior Institutional Business Development Manager | T +61 2 9994 7867 | M +61 417 675 289 | lmead@challenger.com.au | www.challengerim.com.au
Disclaimer: The information contained in this publication has been prepared solely for solely for the addressee. The information has been prepared on the basis that the Client is a wholesale client within the meaning of the Corporations Act 2001 (Cth), is general in nature and is not intended to constitute advice or a securities recommendation. It should be regarded as general information only rather than advice. Because of that, the Client should, before acting on any such information, consider its appropriateness, having regard to the Client’s objectives, financial situation and needs. Any information provided or conclusions made in this report, whether express or implied, do not take into account the investment objectives, financial situation and particular needs of the Client. Past performance is not a guide to future performance. Neither Fidante Partners Limited ABN 94 002 895 592 AFSL 234 668 (Fidante Partners) nor any other person guarantees the repayment of capital or any particular rate of return of the Client portfolio. Except to the extent prohibited by statute, Fidante Partners or any director, officer, employee or agent of Fidante Partners, do not accept any liability (whether in negligence or otherwise) for any errors or omissions contained in this report.