
Market Review & Outlook:
Non-Financial Credit
Uptick in volatility and modestly wider credit spreads although has not translated into a slowdown in primary market activity. Regional, sector and issuer-level dispersion continue to tick up.
Over the quarter, credit spreads widened across all sectors as credit investors grappled with the dual headwinds of AI-led disruption and a volatile macroeconomic backdrop since the onset of the war in the Middle East. Considering the potentially severe impacts on global growth and inflation in the event of a protracted conflict, credit market participants appear to be relatively sanguine with spreads moves much more contained than in the aftermath of Liberation Day.
US HY bonds widened by 52bps over the month, compared to 34bps for US BB Leveraged Loans. While the US HY bond market has lower exposure to technology and software, it has a retail investor base representing around 50% of the market, making it more sensitive to headline shocks. Of note, CCC rated credits are trading around the 55th percentile of spreads since 2007, showing significant decompression from higher rated credits with the overall US HY bond market still trading around the 19th percentile.
Asset Swap margins Across Key Markets
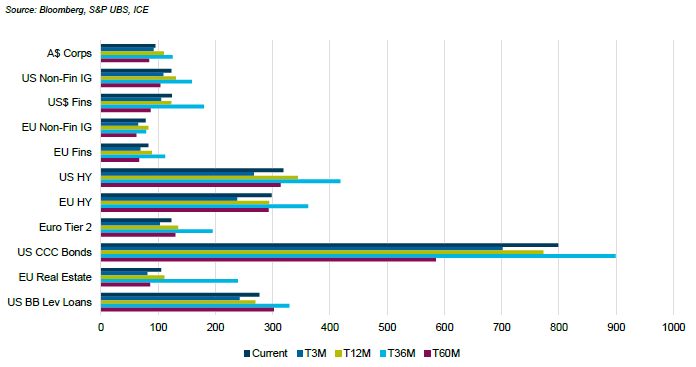
Divergence between US and European credit has been playing out since the onset of the war with EUR non-financial credit spreads underperforming USD non-financial credit spreads given Europe’s greater reliance on energy and fertilizer imports and a more hawkish central bank outlook (even prior to the start of the conflict). EUR IG spreads are 10bps wider over the month of March while US IG spreads are 6bps wider. The divergence is more pronounced in HY with EUR HY 54bps wider versus 21bps for US HY.
Sectoral dispersion is also increasing across both IG and HY credit markets. In the US HY market, the distress ratio (defined as the proportion of face value of bonds with OAS > 1000bps) ranges from 24% for the cable sector to less than 1% for energy, metals & mining and utilities.
Mergers & acquisitions activity has remained somewhat resilient to geopolitical uncertainty with a healthy forward-looking pipeline, although activity has been skewed towards strategic M&A with global strategic M&A volumes hitting a new year-to-date high. By contrast, sponsored M&A activity has been more subdued.
In the US leveraged loan market, alongside M&A activity, refinancing activity slowed down only marginally in Q1 2026 with refinancings making up 39% of total leveraged loan issuance. Similar themes were observed across domestic leveraged finance markets which continued to see refinancing and selective dividend recapitalisation transactions go ahead despite the weaker macroeconomic backdrop.
Rating actions across offshore corporate credit markets continue to be skewed to the downside. The ratio of upgrades-to-downgrades in the US leveraged loan market was 0.75 over the quarter. Meanwhile in the USD IG corporate credit market a large proportion of BBB rated bonds are on negative outlook, led by a few large capital structures. Negative impacts from the Middle East conflict on corporate fundamentals would be expected to flow through on a lagged basis.
Developments in private credit continue to be closely watched by market participants. Softer performance coupled with AI disruption risks and ongoing negative headlines have led to an acceleration in retail redemptions out of non-traded BDCs and have weighed down on sales, pushing Q1 net flows into negative territory for the first quarter on record. While some managers have responded by activating redemption gates others have tapped various liquidity sources in order to meet the redemptions in full. BDC shares have continued to trade down with the median price-to-NAV sitting at around 73% as of March month-end.
Financial Credit
Constructive on Financials particularly G-SIBs although asset quality trends are one to watch. AUD Financials look expensive relative to USD and EUR Financials.
USD financials have underperformed non-financials year-to-date largely driven by heavy primary supply. USD IG banks spreads entered the year 13bps rich to non-financials, the basis reverted over the course of the quarter to +10bps. USD Financials also underperformed EUR Financials on a spread basis over the quarter, with AUD outperforming non-AUD.
Funding conditions in the AUD market remained favourable for the Big 4 domestic banks over the quarter. CBA priced a 5year senior unsecured deal at 74bps in January, followed by Westpac pricing at 68bps in mid-February. At the peak of the market volatility in March, 5-year major bank senior unsecured spreads reached 77bps. Bank funding is likely to further benefit from APRA’s intention (subject to further industry consultation) of broadening HQLA eligibility to include covered bonds.
Bank Spreads
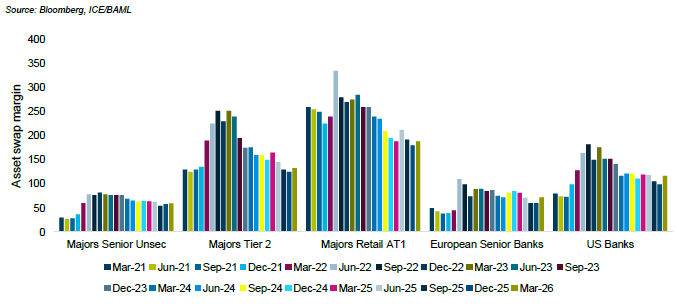
Sentiment towards domestic banks also benefited, in relative terms, from lower system wide exposure to perceived risks from offshore private credit. Nevertheless, the sustainability of the near pristine asset quality of domestic banks’ lending books remains a topic of active debate. Media reports suggest that losses related to recent fraud events in offshore private credit, such as the collapse of UK lender Market Financial Solutions, have prompted some lenders such as Barclays to review their risk appetite for asset-based lending to smaller borrowers.
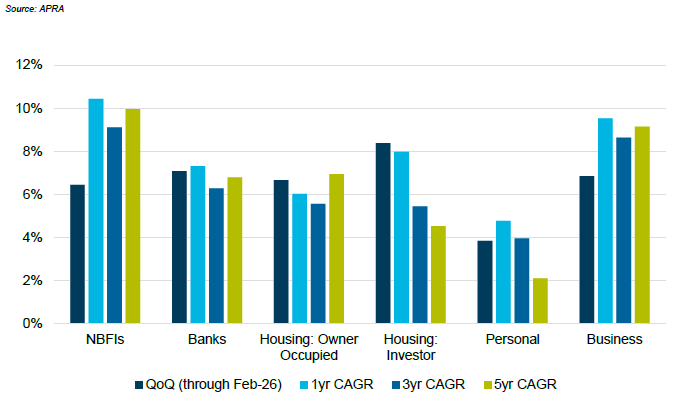
Domestic credit growth has been robust, despite the back-to-back RBA rate hikes, with growth in investor residential lending outpacing the growth in owner occupied residential lending. Of note, Macquarie continues to capture market share in both deposits and residential mortgages.
Australian Bank Lending Exposures by Sector
Securitised Credit
Spreads are directionally wider with limited decompression across Australian ABS relative to offshore ABS.
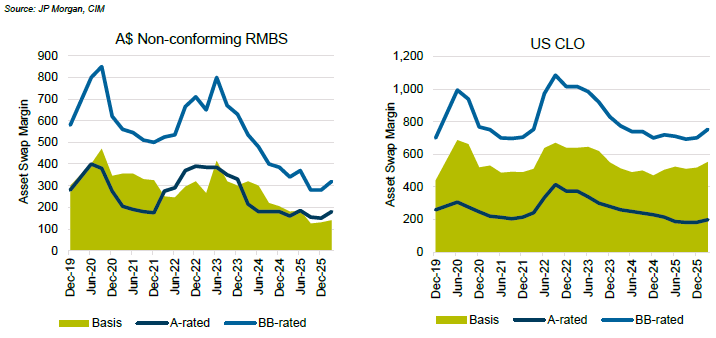
The Australian dollar securitisation market started the year strong with A$22.2bn in issuance volume over Q1, outpacing prior years. Spreads held up well initially despite the heavy supply but began to soften from mid-February. By March month-end, senior and mezzanine tranches had widened by circa 7bps and 10-15bps, respectively. Mezzanine spreads showed limited decompression across rating bands with the basis between BB-rated and A-rated tranches remaining close to historical tights as shown below.
In contrast, the US CLO A-BB basis has been widening since the start of the year with US CLO BB spreads 51bps wider over the quarter. Headlines around private credit and concerns around AI-led disruption have weighed on CLO debt as investors demand more compensation for growing tail risk within CLO portfolios particularly across junior mezzanine tranches where there is less structural protection from credit losses. The spread widening across the CLO market has been accompanied by increasing dispersion as transactions backed by high quality collateral pools have been better bid relative to those backed by seasoned pools with heavier software exposure.
Securitised Pricing
Amidst a volatile market backdrop in March, CLO secondary trading volume set a new monthly record at $44bn while primary issuance that started the year strong slowed down by 40% MoM.
In European ABS markets, issuance continued despite the macro volatility in March with transactions pricing during windows of market stability. Spreads were modestly wider over the quarter with senior and mezzanine spreads widening by 5-8bps and 15-25bps, respectively.
Over the period, the RBA delivered two consecutive rate hikes. The flow on impact from these rate hikes, coupled with rising petrol prices, on household real incomes and securitisation collateral performance is yet to be seen. Thus far, Australian ABS and RMBS collateral performance has remained broadly stable with the S&P Australian Non-Conforming SPIN index showing a small uptick in 30+ delinquencies from 3.84% as of Dec-25 to 3.90% as of Feb-26. The Australian Auto ABS SPIN index is showing an increase from 1.11% to 1.30% over the same period. In European ABS, collateral performance has been somewhat weaker with some auto and consumer ABS transactions underperforming the rating agency base case which might lead to potential downgrades in the near term.
Real Estate Loans
Tightening in lending conditions coupled with hawkish RBA outlook expected to lead to repricing of risk across the sector with construction most affected.
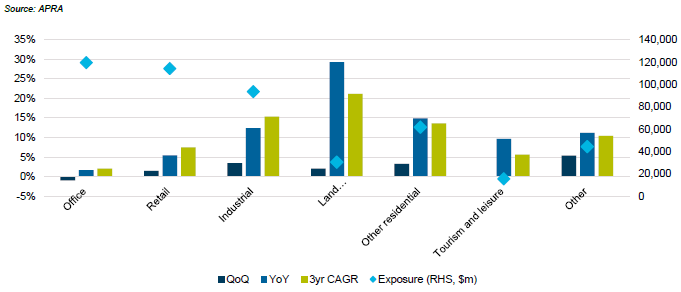
Bank exposure to commercial real estate grew 1.8% in the December quarter. Year on year growth in exposures was 8.8%, in line with the 3-year annualised growth rate of 8.9%. Industrial showed strong growth at 3.5% QoQ while land development/subdivisions saw a deceleration with 2.1% QoQ growth versus 29.3% for the year and 21.1% p.a. on a 3-year CAGR.
Australian Bank Commercial Real Estate Lending Exposures
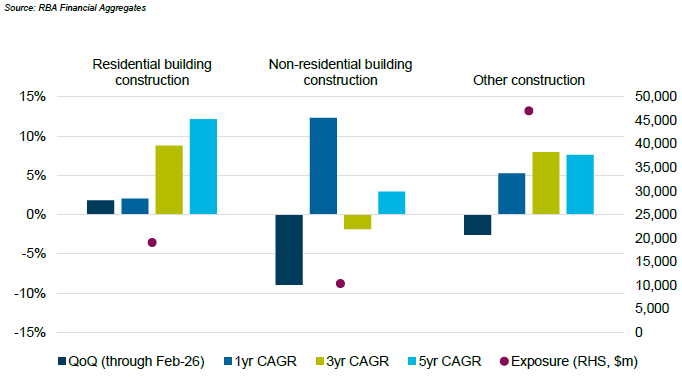
RBA data showed a continued slowdown in residential construction lending growth, up 1.8% for the quarter with 1yr growth at 2.0% versus a 3yr CAGR of 8.8%. Growth in non-residential and other construction lending also contracted meaningfully over the quarter. It is expected that bank lending growth will continue to contract over the coming months with expected cash rate increases in 2026 resulting in reduced interest coverage and pressuring property valuations.
Construction Loans
Anecdotal feedback across the non-bank market points to a softening in demand with some market participants unwilling to extend positions prioritising liquidity in the face of increased redemption pressures and/or reducing allocations from institutional investors. Evidence of stress in the construction sector is starting to emerge with evidence of materials cost inflation heightening risk of cost overruns and the requirement of increased funding limits, all in the backdrop of valuation pressures. The pre-development sector (i.e. land banking) is expected to be most affected as it re-rates to account for both cost inflation and any softening in property valuations.
On behalf of the team, thanks for reading.
Challenger Investment Management
For further information, please contact:
Linda Mead
Senior Institutional Business Development Manager | T +612 9994 7867 | M +61 417 675 289 | lmead@challenger.com.au |
Disclaimer: The information contained in this publication has been prepared solely for the addressee. The information has been prepared on the basis that the Client is a wholesale client within the meaning of the Corporations Act 2001 (Cth), is general in nature and is not intended to constitute advice or a securities recommendation. It should be regarded as general information only rather than advice. Because of that, the Client should, before acting on any such information, consider its appropriateness, having regard to the Client’s objectives, financial situation and needs. Any information provided or conclusions made in this report, whether express or implied, do not take into account the investment objectives, financial situation and particular needs of the Client. Past performance is not a guide to future performance. Neither Fidante Partners Limited ABN 94 002 895 592 AFSL 234 668 (Fidante Partners) nor any other person guarantees the repayment of capital or any particular rate of return of the Client portfolio. Except to the extent prohibited by statute, Fidante Partners or any director, officer, employee or agent of Fidante Partners, do not accept any liability (whether in negligence or otherwise) for any errors or omissions contained in this report.