Market Review & Outlook:
Non-Financial Credit:
Summary views: More anecdotal stress but spreads remain at tight levels. Activity in private markets has increased and spreads have tightened though illiquidity premiums remain attractive.
Spreads tightened meaningfully in the third quarter. US high yield bonds ended the quarter at an asset swapped margin of 278 basis points having hit a low of 265 basis points during the quarter. Whilst not the absolute low in spreads (this occurred in January 2025 when spreads reached 258 basis points), US high yield spreads are at the 3rd percentile of spreads since 2007. This is the tightest of all markets in percentile terms. European high yield, US leveraged loans and European subordinated financials are all trading inside of the 10th percentile. US CMBS is the cheapest asset trading at the 50th percentile and investment grade corporate markets are trading around the 20th percentile.
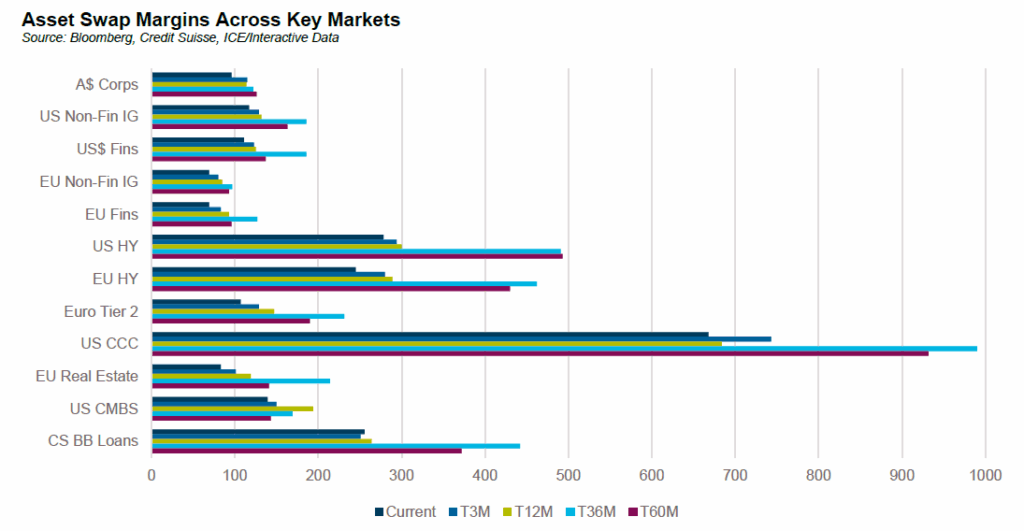
Of interest, CCC rated credits are trading around the 20th percentile in terms of spreads, trailing the performing high yield market. Despite default activity declining over the quarter, high profile cases spooked the market. The most notable was First Brands Group, a US auto parts company which filed in late September with roughly US$4.9 billion in debt. According to S&P the global speculative grade default rate has declined to 3.5% with the CCC share of the overall index extremely low at 11% of par value (lowest since 2022) and 9.3% by market value (the lowest since 2006). Due to neutral ratings drift, the low share of market is mostly due to the lack of primary issuance in CCCs which have represented only about 2% of total issuance.
Net upgrades appeared across the globe in the third quarter although negative bias increased for B- and below rated issuers. Most of the negative bias was focused in autos and chemicals with the consumer products sector also on most watch lists due to tariff related concerns. The weighted average effective US tariff rates have increased from 2% to just over 10% by August 2025 with the weighted average announced tariff rate at c. 17% a reminder that trade policy will continue to impact fundamentals and sentiment.
Issuance over the quarter was strong. Within the US high yield market, primary issuance levels as a percent of the index were the highest since 2021. Citi projects US investment grade issuance to exceed US$1.5 trillion in 2025 for only the second time in history (the first being 2020). Domestically, AUD corporate bond issuance was A$40 billion in the third quarter with 2025 issuance already exceeding A$120 billion.
Second quarter earnings were stable but slower than previous quarters. Corporate fundamentals remain sound aside from individual cases such as First Brands. The Golub Capital Middle Market Report highlighted that Q325 earnings grew at 3.3% YoY and revenues at 4% YoY. This was slower than the previous quarter and considerably slower than Q324. In addition, Golub’s index of middle market borrowers is performing worse than large cap corporates with Q1 and Q2 earnings for S&P600 constituents in the high single digits compared to 5% and lower for mid-market corporates.
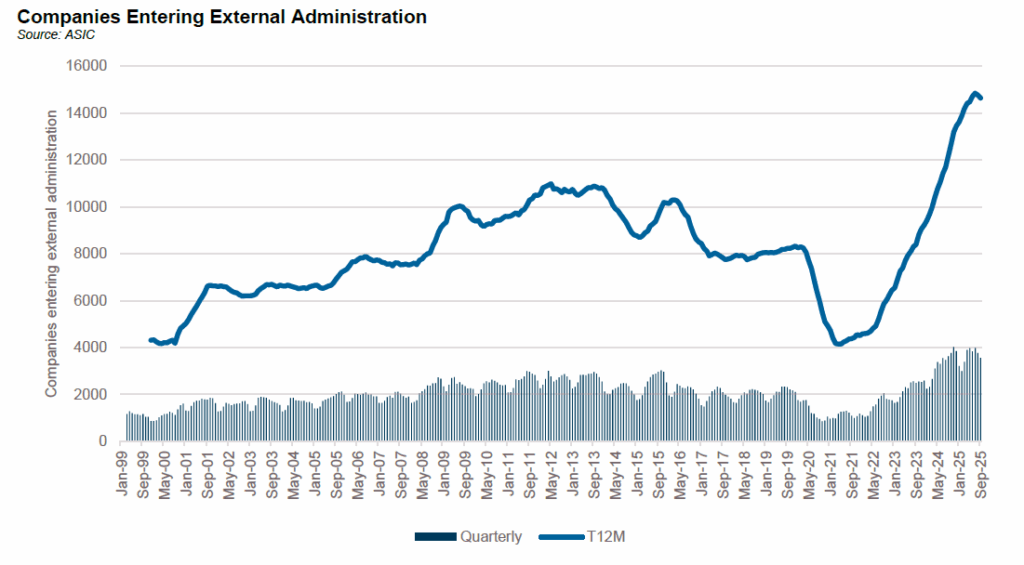
Domestically insolvency data continues to level off at elevated levels of around 3,500 insolvencies per quarter. Construction companies represented 24% of all insolvencies in the quarter, the largest contributor and in line with recent levels. By any reasonable estimation the COVID lull in insolvency activity has now been more than fully caught up.
While corporate fundamentals in private and public markets appear adequate in the aggregate there are some signs of tightness emerging. A key area of focus is business development companies (BDCs) which are trading at meaningful discounts to their net tangible asset (NTA) values. BDCs are listed investment vehicles which hold privately originated loans (sound familiar). In most respects they are very similar to listed investment trusts (LITs) in Australia. According to Raymond James, the mean discount to NTA is currently 17% with the median BDC at a 22% discount. Bonds issued by BDCs have also come under the spotlight. The Bloomberg BDC index which comprises US$75 billion in outstanding debt widened by close to 40 basis points in early October contrasting with the broader corporate index which only widened by 5-10 basis points.
Domestically private credit LITs have also come under some pressure though not nearly as much as BDCs. The mean discount to NTA is c. 3% and the median discount is 2%. As recently as early September the majority of private credit LITs were trading at a premium to NTA. The timing of the price reversal coincided with the release of ASIC’s investigation into private markets, stop orders being placed on several funds, ongoing actions against superannuation trustees, platforms, consultants and advisors related to the First Guardian losses and a high profile downgrade of a large private credit fund.
These events, plus those offshore mentioned above, combined to contribute to a sharp reversal in sentiment.
There has also been a sharp increase in focus on the private credit sector from all corners with due diligence requests coming from clients, platforms, leverage providers, trustees and consultants. More is expected from ASIC in the coming months. Despite solid underlying performance, private credit is clearly being viewed through a more sceptical lens. It is still too early to say what the impact of this newfound scepticism will be.
Financial Credit:
Summary views: ongoing run-off in listed AT1 is affecting pricing of all credit risk in Australia including financials. Australian dollar denominated issuance is expensive versus alternative currencies.
Financial paper tightened along with broader credit markets over the quarter with higher beta outperforming. The run-off in bank issued Additional Tier 1 (AT1) subordinated capital instruments continued with $1.7 billion in calls taking outstandings down to $36 billion with another $1.275 billion due to be repaid in the fourth quarter. AT1s are trading at about 190 basis points over bank bills but most were issued at spreads in the mid-200s or higher leaving market participants with limited alternatives that offer the same combination of high income and low volatility.
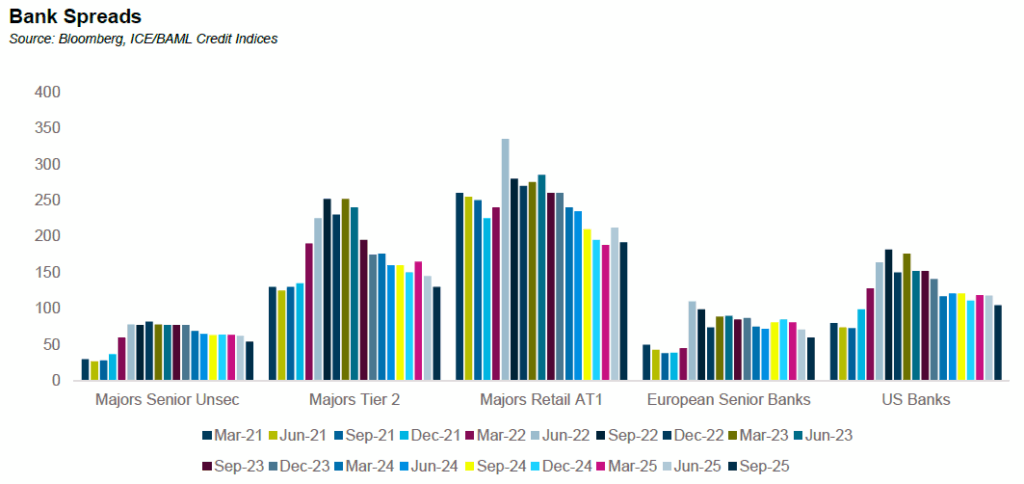
Domestic bank paper has outperformed in recent quarters, especially in sub debt. European banks are lagging with senior spreads at early 2022 levels contrasting with domestic Tier 2 which is at September 2021 levels. Even for equivalent credit risk, the Australian dollar curve is tight. This was evidenced most clearly by UBS issuing an AT1 in Australian dollars at a margin of 278 basis points over bank bills while USD denominated UBS AT1 was trading wider than 300 basis points.
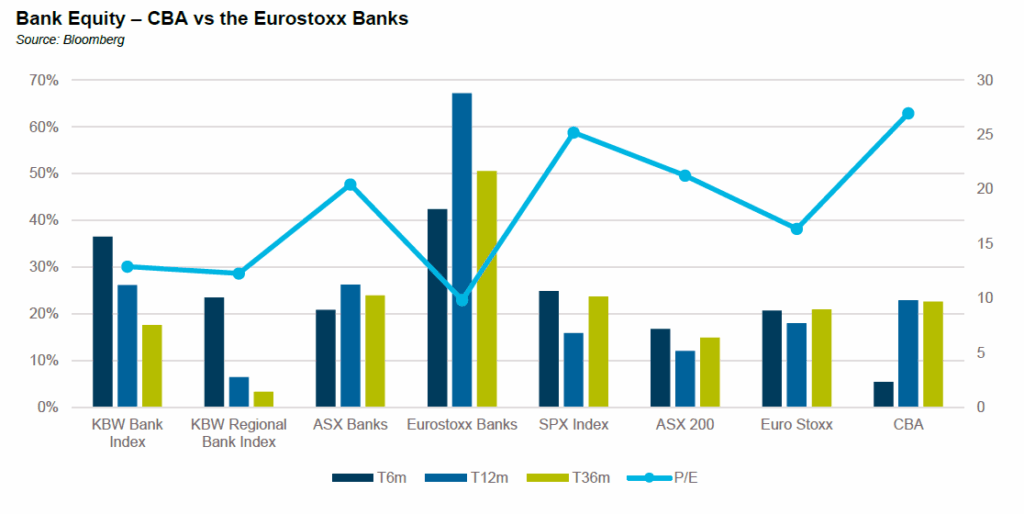
In previous quarters we have called out the strong performance of the domestic banks, particularly CBA which at the peak was trading at c. 3.5 times tangible book value. However, in recent months the strong performance has come from European banks which are up over 40% in only 6 months. Over the same period CBA is only up 5% though it still trades at an estimated earnings multiple of over 25 times, more than double the multiple of the Eurostoxx bank index.
US regional banks had also performed well over recent quarters though post quarter end several regional banks disclosed increased provisions related to fraud on their C&I portfolios causing the regional bank index to decline 5%. In contrast the US major banks mostly reported flat net charge offs even as some took provisions against exposure to the Tricolor fraud. Domestic data is more stale; non-performing loans at 30 June were flat over the quarter at 1.2% but up 0.4% from the low of 0.8% reached in March 2023.
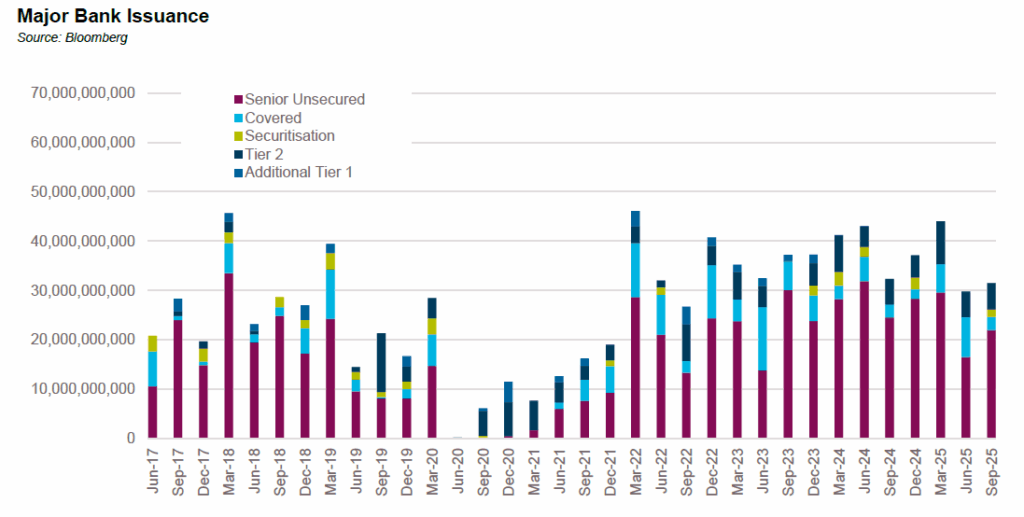
Issuance levels for the banks were slow again in the third quarter despite the easy funding conditions. Total long term debt outstanding for the major banks has declined by around A$2.7 billion since March. Loans increased sharply over this period increasing A$80 billion while corporate and household deposits were only up by A$60 billion over the same period. The difference was picked up by short term funding markets and NCDs.
ABS & Whole Loans:
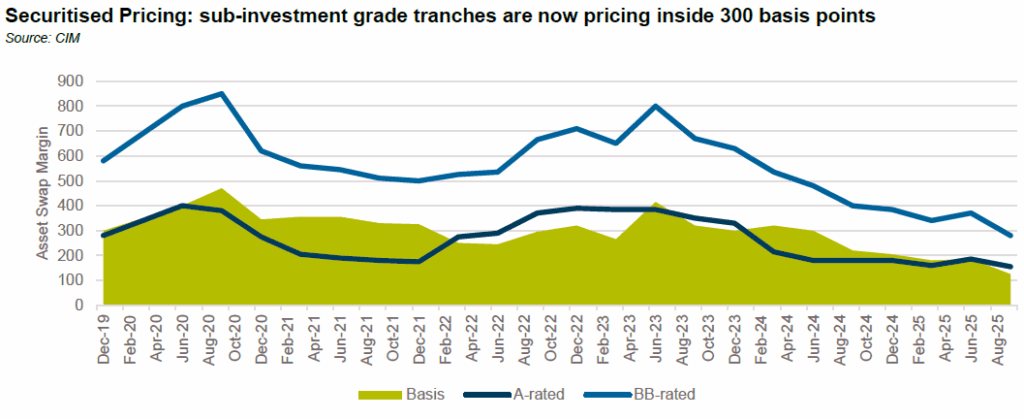
Summary views: spreads are very tight with sub-investment grade tranches below pre-GFC levels.
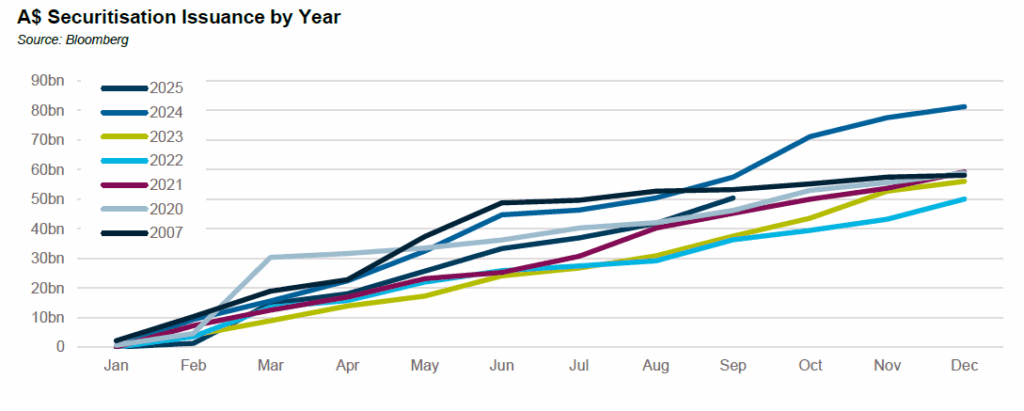
The Australian dollar securitisation was back to form in the third quarter. A$17 billion was issued in primary markets, the busiest third quarter since 2021. Year to date issuance is already over $50 billion trailing only 2024 and 2007. Non-banks represent over 90% of YTD issuance, the highest on record.
Non-AAA rated issuance was A$1.7 billion well below the peak quarter of A$2.8 billion in Q2 2024. Non-AAA rated tranches represent around 10% of a A$200 billion market. The non-investment grade share is even lower at around 1.5% of the total market. For context, the A$ UBS AT1 issued in September was A$1.25 billion in size, exceeding the total amount of sub-investment grade securitised issuance in 2025.
Globally the sector has been on the front pages due to the issues in the Tricolor securitisation. Tricolor is a non-bank originator focussed on sub-prime auto lending to undocumented immigrants. It collapsed in September amid allegations that they had pledged the same collateral to multiple lenders. Within public markets there is only US$1.5 billion in Tricolor issued ABS outstanding, less than 1% of the US auto ABS market and around 2% of the subprime auto ABS market.
While the Tricolor bonds have plunged in value (TAST 2025-2A E notes, originally rated BB are trading at 10 cents in the dollar while the senior tranche is trading at 72 cents), there has been minimal contagion into broader securitisation markets. Subprime auto spreads are only around 50 basis points wider in the sub-investment grade tranches, marginally underperforming equivalently rated marketplace lenders which has historically been a higher beta sector.
Part of the rationale for the lack of contagion has been the strength in collateral performance. 30+ day delinquencies for retail credit cards have stabilised at around 3% with prime auto loans flat at 2%. Subprime Auto ABS delinquencies have increased with 30+ delinquencies at 16.3% up 1.7% on a YoY basis.
Issuance in US auto ABS has held up with close to US$260 billion in issuance YTD already outpacing 2022 and 2023 full year numbers. The total US ABS market is close to US$850 billion. The story is similar in US residential mortgage backed markets with US$150 billion in issuance YTD, exceeding 2023 and 2022’s full year numbers and almost reaching 2024’s total. US RMBS delinquencies also remain contained with few signs of an upwards trend.
In Europe placed issuance is EUR128.3 billion YTD, outpacing 2024 YTD numbers. In 2025 around 40% of total issuance has come from CLOs, up from a third in 2024. The ECB’s ABS portfolio has also continued to decline and is now below EUR4 billion.
Demand from CLO’s drove leveraged loan spreads over the quarter. In the 12 months to September 2025, the overall market has grown by 12% with the strongest growth in middle market CLOs (up 34% and approaching US$200 billion in outstandings). Underlying performance has been solid with Caa/CCC buckets (ie the share of CCC/Caa rated loans in the overall CLO portfolio) declining by 0.8%/1.8% over the year to 4.6%/4.1%, respectively. Caa/CCC buckets in European CLOs have been broadly flat at 4.7% and 3.5%, respectively.
Domestic fundamentals are also benign with no signs of an increase in delinquencies helping to keep spreads at extremely tight levels. The pace of tightening has slowed but with Tier 2 pricing declining over the quarter, there is the potential of further tightening.
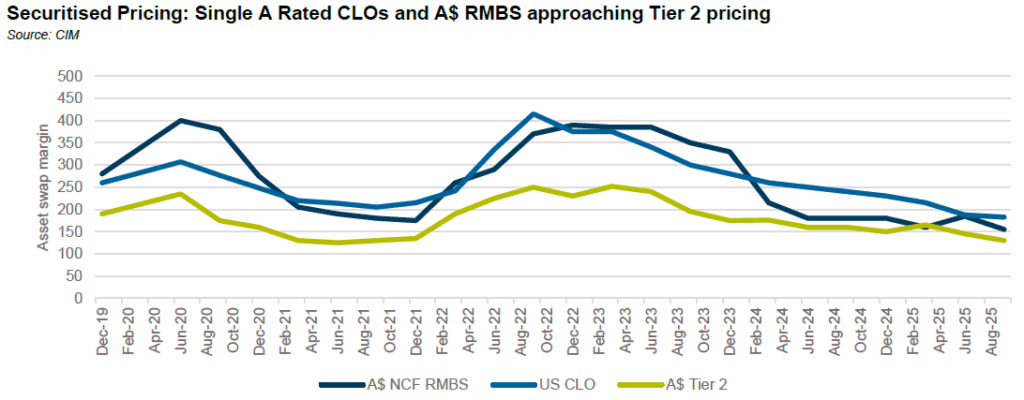
Pricing in A$ sub-investment grade has rallied sharply. BB-tranches are now 500 basis points tighter than the COVID wides and only slightly over 100 basis points wider than A rated tranches, the tightest basis on record. For context, the last time BB tranches priced in the high 200s in spread terms (pre-GFC), single A rated tranches were trading below 100s implying a basis of circa 200 basis points.
Real Estate Loans:
Summary views: More opportunities in private markets but greater competition with banks re-entering the market. Asset quality risks remain unreported but domestic and global indicators suggest they do exist.
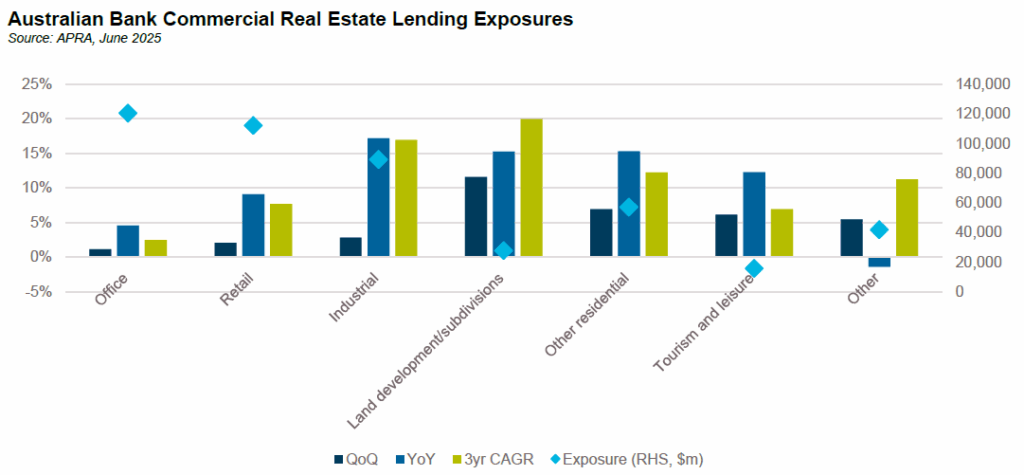
Bank exposure to commercial real estate grew 3.5% in the June quarter, a sharp increase on the March quarter. Year on year growth in exposures was 9.4%, in line with the 3 year annualised growth rate of around 9.1%.
The strongest growth came in land development/subdivisions which were up 11.6% for the quarter and are now up 15.3% for the year and 20% p.a. on a 3 year CAGR. APRA’s clarification of its guidance from March of 2017 to say that they didn’t stipulate that banks must have presale coverage equivalent to at least 100% of committed debt but were rather referencing industry practice at the time seems to have had the desired impact.
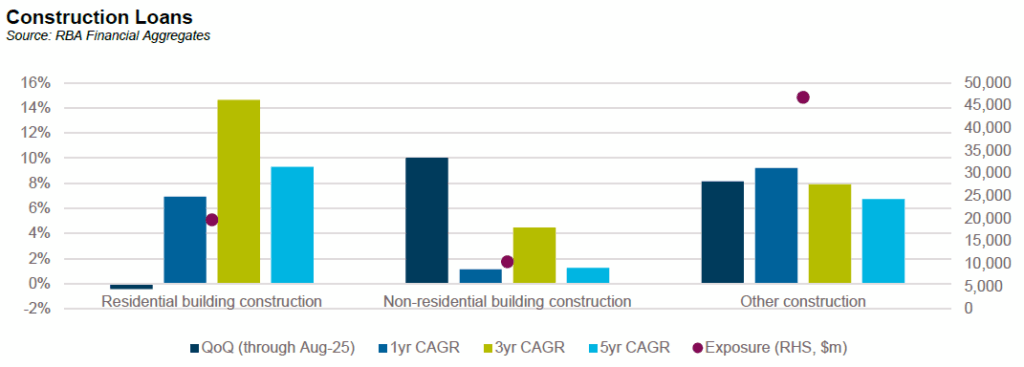
RBA data showed that through August residential construction lending growth was down -0.4% for the quarter, a sharp slowdown with 1yr growth at 6.9% and a 3yr CAGR of 14.6%. Growth in non-residential and other construction lending was much stronger over the quarter with both up by 8-10%.
The combination of stronger demand from banks and lower lending volumes overall appears to be putting downwards pressure on lending margins. Based on publicly available data, returns on private CRE loans have compressed sharply over the past year some with managers reporting 1yr returns in the Cash + 3% area after fees implying lending margins in the 4-5% area.
This competition point was echoed in a recently completed report from London’s Bayes Business School. They highlighted that in the UK, lending margins on residential developments fell below 500 basis points for the first time since 2020, averaging 474 basis points at a loan to cost ratio of 63%.
The reporting of the loan to cost ratio is a healthy contrast to the Australian convention of reporting loan to value ratios with little clarification as to how the estimate of value is derived (a point ASIC called out in their paper on private credit). A rough rule of thumb is that loan to value is around 15% lower than loan to cost so a 65% loan to value ratio is more like an 80% loan to cost.
The Bayes report also touched on asset quality. They reported an overall default rate of 6.3% driven by debt funds which had a 20.3% default rate at June 2025, up from 15.2% in December 2024. This aligns with CMBS data from the United States which showed that 30+ delinquencies on office loans was over 11% up from less than 10% 6 months ago with special servicing rates at 16.91% up from 12.58% a year ago.
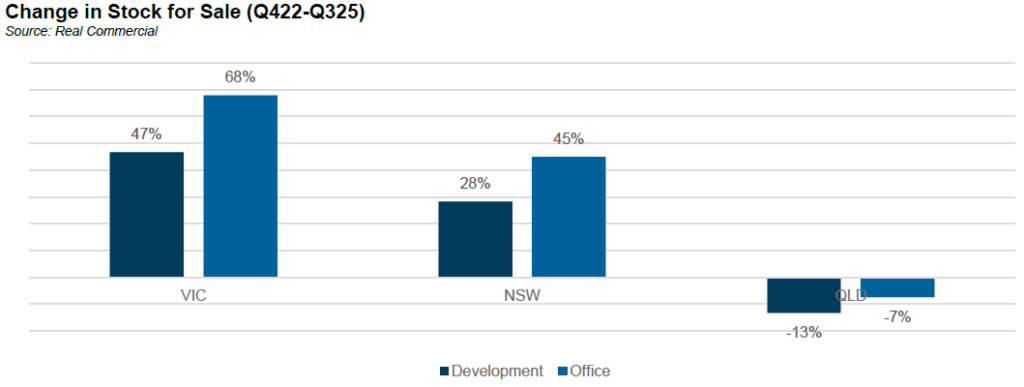
Domestically a loud minority of CRE lenders are reporting asset quality issues though there are data points suggesting that conditions are worse than what is being reported. As we have previously discussed, over the past few years there has been a strong uptick in the available stock of sites for sale particularly across NSW and Victoria. Since the lows in 2022, stock available for sale in NSW and Victoria is up sharply and this figure continues to grow. Within the banks, non-performing CRE loans are at 0.8% of total loans, up from 0.5% at the lows.
On behalf of the team, thanks for reading.
Pete Robinson
Head of Investment Strategy – Fixed Income | +61 2 9994 7080 | probinson@challenger.com.au
For further information, please contact:
Linda Mead | Senior Institutional Business Development Manager | T +61 2 9994 7867 | M +61 417 675 289 | lmead@challenger.com.au | www.challengerim.com.au
Disclaimer: The information contained in this publication has been prepared solely for solely for the addressee. The information has been prepared on the basis that the Client is a wholesale client within the meaning of the Corporations Act 2001 (Cth), is general in nature and is not intended to constitute advice or a securities recommendation. It should be regarded as general information only rather than advice. Because of that, the Client should, before acting on any such information, consider its appropriateness, having regard to the Client’s objectives, financial situation and needs. Any information provided or conclusions made in this report, whether express or implied, do not take into account the investment objectives, financial situation and particular needs of the Client. Past performance is not a guide to future performance. Neither Fidante Partners Limited ABN 94 002 895 592 AFSL 234 668 (Fidante Partners) nor any other person guarantees the repayment of capital or any particular rate of return of the Client portfolio. Except to the extent prohibited by statute, Fidante Partners or any director, officer, employee or agent of Fidante Partners, do not accept any liability (whether in negligence or otherwise) for any errors or omissions contained in this report.