

Market Review & Outlook:
Non-Financial Credit
Non-financial corporates remained resilient despite continued geopolitical risks and rising interest rates with fundamentals continuing to be strong. However, dispersion continues to be a theme with investors showing caution on the lower end of the credit spectrum and moving up in quality.
The US-Iran conflict remained an important macro driver during the September quarter. The interim agreement reached in June had sought to extend the ceasefire and restore traffic through the Strait of Hormuz. However, the arrangement remained fragile leading to renewed attacks in the region. Oil prices have subsequently increased to ~US$90/barrel from ~US$70/barrel and having traded above US$100/barrel over the quarter. The persistence of elevated energy prices feeding into higher inputs costs have complicated the inflation outlook. The rates market reflected these concerns with the US 10 year treasury yield increasing from 4.5% to 5.3%, while the Australian 10 year government bond yield increased from 4.7% to 5.4%, levels last seen in 2002 and 2010 respectively. The Fed, ECB, BoJ and RBA all hiked interest rates by 0.25% over the quarter citing elevated inflation. This was the first hike by the Fed since Aug 23, reversing prior rate cut expectations at the start of the year. Investors are now expecting interest rates to stay higher for longer.
Despite the backdrop of continued geopolitical conflicts, elevated energy prices and rates repricing, higher quality corporate credit remained comparatively resilient. Q3 2026 saw ~US$500bn of US IG issuance, which was the third largest quarter of issuance on record. The driver was a surge in bond issuance related to the AI buildout.
US investment grade non-financial spreads were relatively unchanged over the month as corporate fundamentals remained resilient. The S&P 500 achieved an astonishing 54% earnings growth for the Q2 earning season (including revaluation gains), the highest earnings growth reading since Q2 2021 (+92%). This was also reflected in rating actions, which saw a positive upgrade/downgrade ratio in the US IG space of 3.1x. Momentum is slowing as it is down from 4.6x in Q2 2026. Dispersion persists further down the credit spectrum. US high yield spreads widened by 24bps, while CCC and lower spreads widened considerably more by 95bps. Investors remained cautious on more leveraged borrowers. While credit spreads were resilient, there was a large divergence between total return performance between fixed and floating rate products driven by the higher interest rate duration of fixed rate bonds.
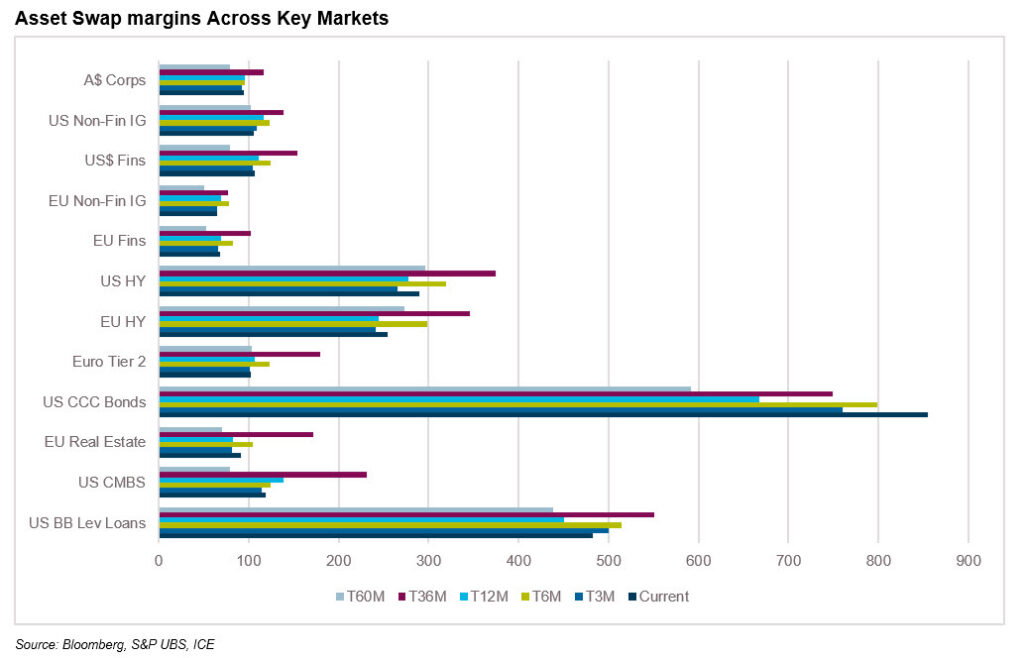
Similar themes were observed in the leveraged loan market. Loans had strong quarterly returns of 2% over the quarter despite the macro backdrop. The S&P Leveraged Loan Technology Index also rallied strongly, returning 4.4% over the quarter and erasing losses earlier in the year to be up 1.3% year to date, although still lagging the broader index. This could be partly attributed to the strong technical demand and/or supply imbalance where Q3 saw US$47.5bn of investor demand (largely driven by CLO demand of US$45.8bn) vs just US$8.5bn of net new loan supply for a US$39bn supply shortfall.
While year to date loan issuance is tracking lower than 2024 and 2025, M&A financing picked up sharply in Sep 26 to US$30.6bn, for the strongest month of M&A loan issuance since Jan 22. However, the market has been growing more selective with higher rated credits increasing as a percentage of new deals with 48% of M&A volume going to BB- or higher borrowers (highest post GFC), while lower rated B- borrowers only made up 14%, down from the last 10 year average of 34%.
Spreads seen to be increasing for lower rated borrowers looking to refinance their debt. Additionally, software has also been declining as a share of the market, with ~10% of loans issued in the BSL market (ex repricings) having come from software companies, down from their 10 year average of ~18% as investors continue to shy away from companies that may be exposed to AI related disruption. This has resulted in higher competition for high quality loans, where new issue spreads have widened more for lower rated borrowers, resulting in the basis between B- and BB- rated issuers increasing from ~100bps to 190bps over the quarter.
While fundamentals have been resilient, with leverage and interest coverage ratios steady over Q2 for the public loan universe, Morgan Stanley estimates that a 100bp refinancing rate shock could add 1 to 1.5% to their 5.5% default base case for 2027.
After a relatively slower previous quarter, the Sep 26 quarter saw healthy activity across the Australian leveraged finance market, both in new M&A deals announced and continuation of refinancings, incremental facilities and sponsor led recapitalisations which we’ve seen in the last 6 to 12 months. Take private activity continued, with private equity and offshore investors pursuing listed businesses, though some of these processes are subject to active competition between bidders and remain open at quarter end.
With the recent noise on private credit, selective local funds appear to have decreased lending activity in recent weeks, though there is still substantial liquidity available in the market from underwriting banks and institutional lenders. On the many refinancings and/or dividend recapitalisation transactions in recent months, existing lenders have rolled or upsized their commitments for the most part.
Financial Credit
Financial credit remained resilient, supported by attractive yields and improving sentiment. However, asset quality amidst increasing competition for assets remain a key focus.
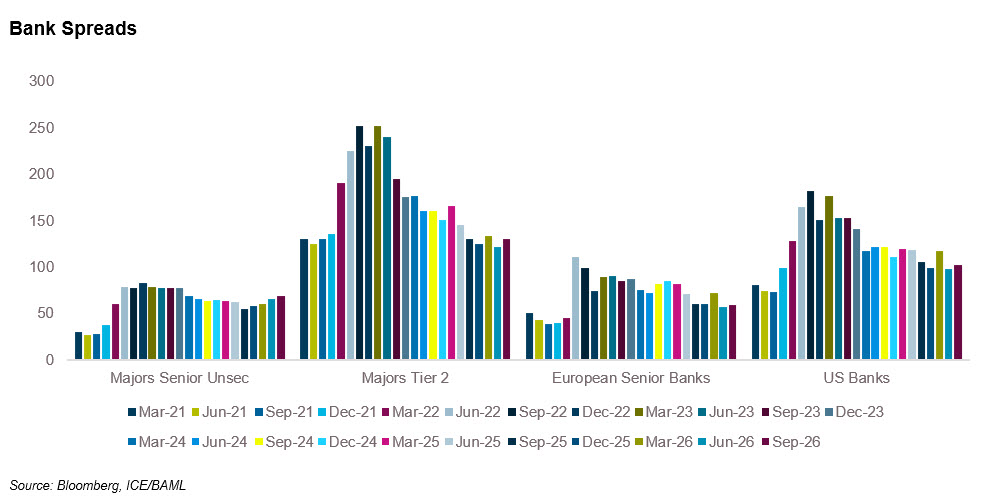
Similar to non-financial credit, financial credit spreads were broadly unchanged to a touch wider by ~2bps over the quarter, despite increasing interest rates over the period, as investors still found all in yields attractive. In the US, while redemption requests are ongoing, there are signs that they are beginning to ease with redemption requests falling vs prior quarters. In fact, sentiment may be shifting with private debt fundraising having seen a sharp rebound, raising US$129bn in the first nine months. An increase of 35% vs the prior year and the highest nine month total going back to 2016. At the same time, direct lending volume dropped 28% in the quarter according to Pitchbook / LCD, which could increase competition for assets. This could be further exacerbated by direct loans being refinanced into the BSL market with US$16.4bn of direct loans refinanced into the BSL market vs US$2.6bn going the other way.
In Europe, financial spreads were also only a touch wider by ~2bps, while non-financial spreads were flat over the quarter. This is despite the recent rates selloff in government bonds mentioned above, where banks are typically large holders of European sovereign bonds. Additionally, banks are typically more domestic, whereas non-financials can be diversified across different regions, leaving banks more exposed to any growth slowdown from tighter fiscal policy. This could potentially lead to underperformance of European financials vs non-financials in the near term.
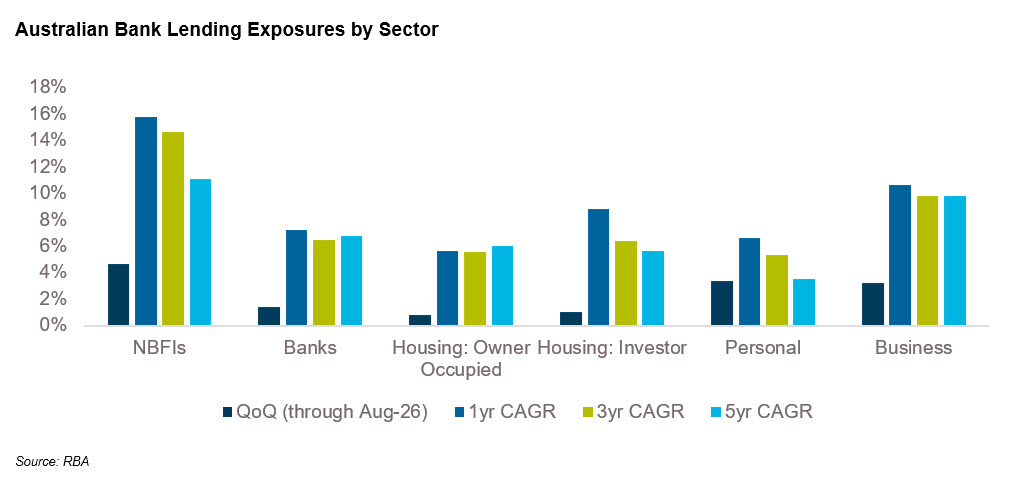
The combination of rising interest rates, falling house prices and rising cost of living has also seen lending growth slowdown for both NBFIs and Banks, although still positive, with NBFI growth at 4.6% vs 6.0% for the prior quarter and Bank growth at 1.4% vs 2.0% for the prior quarter (to Aug 26). In particular, the housing for investment segment dropped from 3.1% to 1.0%, where the recent changes to negative gearing may have contributed to the decline alongside rising interest rates. While competition for assets has been increasing on the back of lower lending volumes, the RBA noted in their October Financial Stability Review that this hasn’t resulted in deteriorating underwriting and lending standards remain sound.
Securitised Credit
Securitised credit absorbed strong issuance, although supply pressures drove some spread widening late in the quarter. Australian collateral performance remained broadly stable, but the full impact of higher rates and inflation may yet emerge. Greater dispersion in lower rated CLOs reinforces the importance of disciplined credit selection.
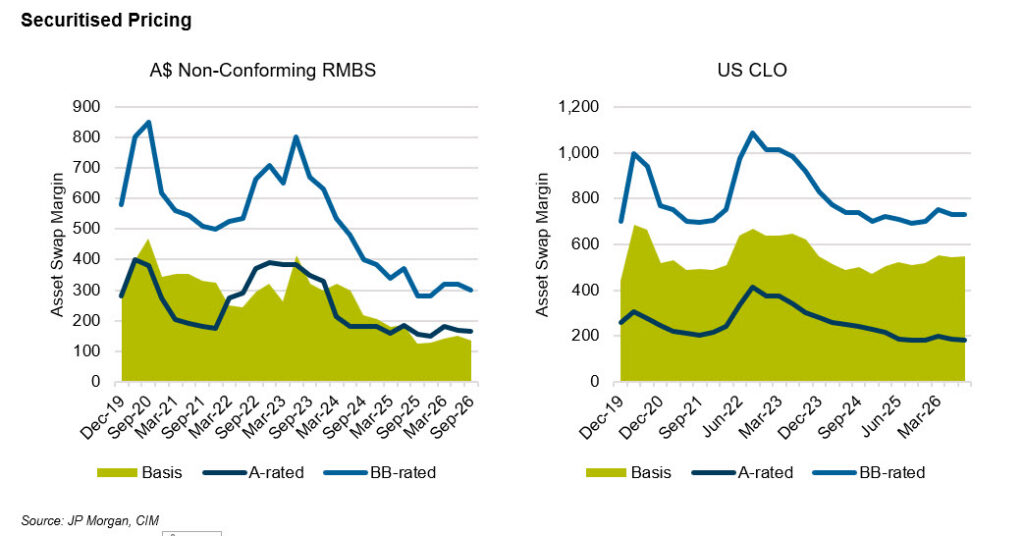
The theme of strong issuance was also prevalent in ABS markets, which saw both Europe and Australia set post GFC quarterly records with Europe issuing €30.9bn and Australia issuing A$43.4bn. The Australian issuance included an unusually large A$15.4bn Cashmere RMBS portfolio refinancing. Excluding Cashmere, Q3 issuance was A$28.0bn. More than A$6bn of transactions were in the pipeline entering Oct 26, indicating that full year issuance could approach A$100bn on a headline basis. Consistent with other sectors, investor demand remained available but became increasingly selective as primary supply accelerated, particularly in Sep 26. Primary spreads generally tightened over the quarter before supply pressure caused pricing to plateau and some mezzanine spreads to widen. Secondary market activity was comparatively subdued as investors focused on new issuance.
RMBS and ABS collateral performance remained broadly stable, although the full impact of recent rate rises and higher inflation may not yet be reflected in arrears levels. RMBS arrears increased for major banks and to a lesser extent other ADIs. Prime and non-conforming non-ADI arrears remained broadly stable. The S&P Australian Non-Conforming SPIN Index recorded a modest increase in 30+ day delinquencies from 3.45% in May 26 to 3.61% in Jul 26. In contrast, the Australian Auto ABS SPIN Index improved, with arrears declining from 1.32% in May 26 to 1.16% in Aug 26. Additionally, the RBA released their Financial Stability Report, where they cited most Australian households and businesses appear to be in strong financial positions to withstand the rise in cost pressures this year, with pockets of elevated stress in some sectors such as hospitality and construction.
Overall, record Q3 issuance was absorbed with some spread pressure emerging as supply increased. Collateral remained broadly stable, while the strong pipeline points to continued investor selectivity in Q4.
In offshore European securitised markets, year–to-date issuance has now reached €87.1bn, ~€12bn higher for the same period vs the record year of 2024. Spreads started to widen at the end of the quarter as the broader macro volatility started to feed through, particularly in UK seniors which saw significant supply. Mezz technicals across £ and € weighed on the demand side with significant coverage on primary deals despite the high volumes of transactions.
There are regulatory tailwinds for European ABS, with changes to Solvency II which will apply on 30 Jan 2027 and the European Parliament’s Committee on Economic and Monetary Affairs voting in May 2026 to lower risk weights for high-quality securitisation. This could mean institutional demand for European ABS may increase when these changes come into effect, particularly for AAA investments, helping to support spread levels.
CLO issuance was similarly strong over the quarter, with ~US$45bn and €16.2bn of new CLO issuance in the US and Europe respectively. While Europe was steady quarter on quarter, the US had a stronger quarterly issuance growth, up 37% vs Q2 levels, which was the market’s weakest quarter in three years. Looking forward, given the compression in spreads in the underlying loans mentioned above and increasing CLO liabilities, CLO equity returns and formation could be under pressure as the arbitrage becomes challenged. However, this could be offset by the regulatory tailwinds in Europe mentioned above, which could support and potentially drive higher rated CLO spreads tighter. Similarly in the US, the National Association of Insurance Commissioners (NAIC), also finalised rules in Q3, which will lower the risk based capital charges for CLO tranches rated A or higher, resulting in some US CLOs starting to structure in a junior single A tranche.
Similar to ABS, spreads were generally tighter over the quarter in CLO markets but started to widen out at the end of the quarter. Manager tiering continues to be subdued on the senior part of the capital structure. For example, a debut CLO manager in Europe priced their AAA at +129bps, only ~5bps wider than an established manager with greater tiering continuing to be observed in the riskier parts of the capital structure. While headline single A to BB basis has been fairly steady, BB spread differences for top vs bottom quartile have now reached ~200bps, with the difference driven by quality of the bonds. Bonds with greater level of market value overcollateralization (MVOC), for example greater than 105% would trade inside 570bps vs greater than 800bps for a BB bonds with MVOC less than 102%.
Real Estate Loans
Commercial real estate lending expanded, although there are signs that growth may be slowing. Higher financing and construction costs continued to pressure developers. The Bathla collapse highlighting credit risks and contributing to redemption restrictions and liquidity pressures among non-bank lenders.
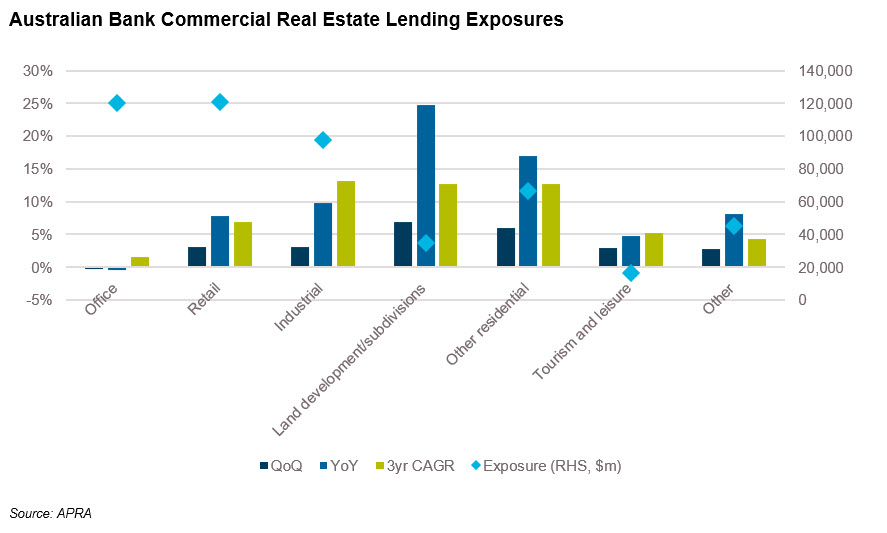
Bank exposure to commercial real estate grew to 2.9% in the June quarter, up from 1.6% in the prior quarter. Year on year growth in exposures was 8.1%, above the 3 year annualised growth rate of 7.3%. Growth in office has remain subdued with year on year growth at 0% and last 3 year growth at 1.6%. The non-performing commercial property exposure ratio (non-performing exposure as a total exposures) was 0.56% at 30 June 2026 (0.76% pcp).
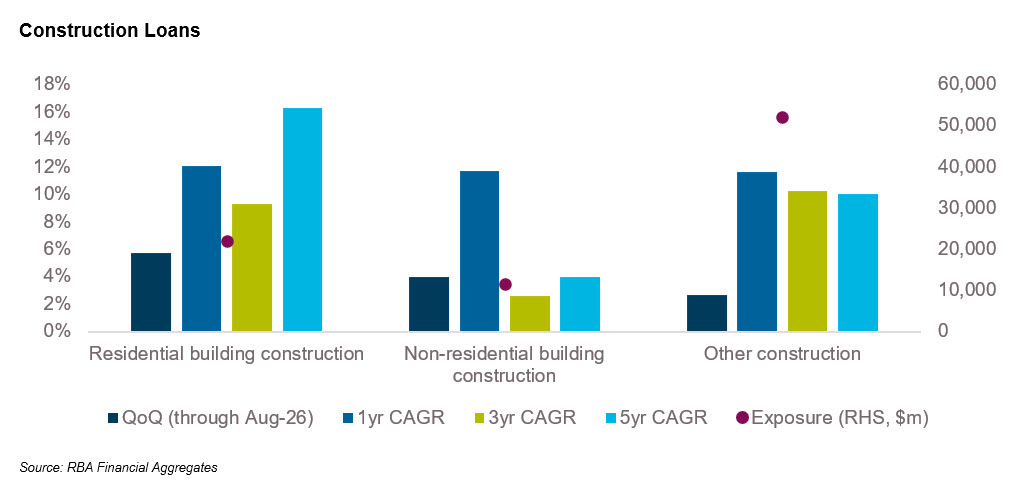
Residential construction has been strong with year on year growth to Aug 26 at 12.1% though there are signs activity could be slowing with RBA data showing a slowdown in residential construction lending growth to 5.2% over the quarter, down vs 9.5% for the previous quarter. Additionally, ABS data in August showed that total dwelling units approvals fell by 6.1%. The greatest decrease coming from private sector dwellings excluding houses (for example apartments, townhouses etc.) falling more sharply by 21.1%. Master Builders Australia also downgraded their outlook for new home building, predicting a 262,000 home deficit vs the National Housing Accord target of 1.2m homes by 2029. Non-residential activity held steady on the quarter at 3.9%, with the 1 year growth remaining elevated at 11.7% vs 5 year historical average of 4.0%, driven by growth in data centres and health.
Costs pressures persist driven by the prolonged conflict in the Middle East, a tight construction labour market and rising interest rates. Notably, these cost pressures have resulted in the collapse of some high profile builders over the quarter, such as Bathla Group. Bathla was one of the largest residential property developers in NSW who went into voluntary administration in late August with $3.3bn of non bank debt owing. The construction industry made up around a third (by count) of all distressed related activities according to ASIC data over the quarter. Bathla’s collapse contributing with likely flow on effects to some of its subcontractors. A large number of private credit groups (non-Challenger) have been caught up in the Bathla collapse with several instances of funds subsequently gating redemptions and increasing illiquidity in the non-bank lending sector.
On behalf of the team, thanks for reading.
Disclaimer: The information contained in this publication has been prepared solely for the addressee. The information has been prepared on the basis that the Client is a wholesale client within the meaning of the Corporations Act 2001 (Cth), is general in nature and is not intended to constitute advice or a securities recommendation. It should be regarded as general information only rather than advice. Because of that, the Client should, before acting on any such information, consider its appropriateness, having regard to the Client’s objectives, financial situation and needs. Any information provided or conclusions made in this report, whether express or implied, do not take into account the investment objectives, financial situation and particular needs of the Client. Past performance is not a guide to future performance. Neither Fidante Partners Limited ABN 94 002 895 592 AFSL 234 668 (Fidante Partners) nor any other person guarantees the repayment of capital or any particular rate of return of the Client portfolio. Except to the extent prohibited by statute, Fidante Partners or any director, officer, employee or agent of Fidante Partners, do not accept any liability (whether in negligence or otherwise) for any errors or omissions contained in this report.