
For my sins I spent much of the global financial crisis searching out opportunities in distressed securitised credit markets. As we emerged from the abyss in 2010, the market started to divide up the world into the survivors of the crisis and those products who would be consigned to the financial dustbin of history. CDOs, CDO squareds (and cubes), CPDOs, SIVs and SIV-lites were all discarded and to this day have not returned.
Other structured products proved far more resilient. Despite sharing a similar acronym to the ill-fated Collateralised Debt Obligation (CDO) and being treated in much the same manner by investors, Collateralised Loan Obligations, AKA CLO’s, survived within minimal damage.
Back in 2010, I first started investing in CLOs. Then the most common question I was asked by the sell-side was, “which CLO managers will you look at?”. Through the GFC there was significant dispersion in performance both because of poor investment decisions and poor governance. With these issues already in the price of the CLOs my response was generally to ask, “who are the managers that are on everyone’s buy list?” Once I knew that I could work out which managers were out of favour but had similar traits to the managers which were on the list. These managers often traded considerably cheaper than the managers that were on the “buy list”.
It paid to not be CLOsed minded.
Before we move on, it’s worth highlighting a few important differences between CLOs and CDOs which should inform you as to why CLOs survived and CDOs did not.
| Collateralised Loan Obligations | Collateralised Debt Obligations | |
| Description | Tranched securities backed by pools of loans to non-financial high yield corporate borrowers | Tranched securities backed by pools of mezzanine bonds themselves backed by pools of residential mortgages |
| Default correlation | If one non-financial corporate borrower defaults, it is not necessarily more likely that another borrower from a different industry will default. | Mortgage defaults, especially when caused by significant declines in house prices, can be highly correlated with each other. This was the case in 2005. |
| Loss given default | The vast majority of loans in a CLO are 1st ranking and senior secured where average loss given defaults were around 30-40%. | Most CDOs held mezzanine RMBS bonds which could suffer a full loss of principal upon a default. |
| Concentration risk | CLOs were only around 50% of the total leveraged loan market US$600 billion leveraged loan market. | In the first half of 2006 over 90% of BBB-rated subprime RMBS bonds were placed into CDOs meaning there were no buyers of BBB-rated tranches of subprime RMBS other than CDOs. |
| Structural leverage | Approximately 63% of the CLO structures were AAA rated | Approximately 75% of the mezzanine CDO structure was AAA rated and 88% of the high grade CDO structure was AAA rated |
| Synthetic leverage | There was not an active derivatives market underlying the leveraged loan market | An active market for CDS on subprime RMBS emerged from around 2003 and grew rapidly allowing excessive speculation via indices such as ABX and TAB-X |
While CLOs survived, the recovery was long and painful. The CLO market declined from a peak of US$308 billion in 2008, reducing to US$264 billion by 2011 as primary issuance ground to a halt. Today the market has grown to around US$1 trillion, a 12% compound annual growth rate. The US institutional leveraged loan market has also grown and is currently over US$1.5 trillion with the CLO share of the market increasing to around 70%.1
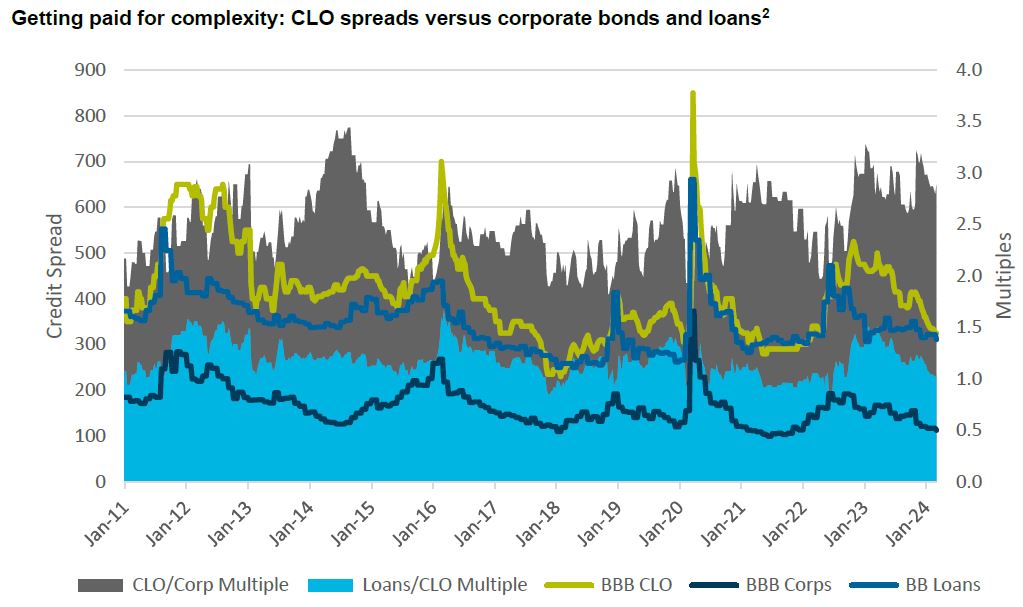
The main justification for the allocation to CLOs is returns. As the below chart shows spreads on BBB-rated CLOs trade wide to BBB-rated corporates and even BB-rated loans. While spreads have rallied over the past 12 months investors in BBB-rated CLOs are still getting more than 2.5 times the spread on similar rated corporates and around the same spread they are getting on BB-rated leveraged loans.
In the period leading up to the GFC, BBB CLO spreads hit around 140 basis points with corporate BBB spreads hitting a low of 67 basis points in 2006 for a 2.1 times multiple.
In terms of risk, the likelihood of a credit loss on a BBB-rated tranche of a CLO is low. CLOs have structural subordination with junior tranches providing a buffer against losses. They also have excess spread which can be diverted to pay down principal plus performance based tests which redirect interest and principal payments from subordinate tranches to senior where asset coverage or interest coverage deteriorates. Currently a BBB tranche of a broadly syndicated CLO benefits from around 12% par subordination.
Even for CLOs issued back in 2005-07 where cumulative default rates for speculative grade issuers hit over 20% with losses in the low teens, defaults on investment grade tranches of CLOs were low. According to S&P only 1.1% of BBB-rated tranches of CLOs issued prior to the GFC ultimately defaulted. For CLOs issued post GFC that figure is zero. That contrasts with a 5 year cumulative default rate of 1.7% for borrowers rated BBB in 2007 and an average five year cumulative default rate of 0.7% for BBB borrowers post GFC.3
Default experience of CLOs is better than corporates
| CLOs | Corporates | |
| Pre-GFC | 1.1% | 1.7% |
| Post GFC | 0.0% | 0.7% |
If the additional spread is not compensation for additional default risk, what is it compensation for?
Some part of the spread pick up is convexity. Most deals today have an expected tenor of 8 years but can be repaid as early as two years into the transaction at the manager’s option. This convexity isn’t worth much – we estimate 25-50 basis points in spread terms. This still leaves over 150 basis points in incremental spread for CLOs relative to corporate bonds.
Is some of the spread pick up for illiquidity? Yes, to a degree but liquidity in CLOs has been improving significantly in recent years. According to SIFMA average daily volume traded in CLOs in 2023 was US$800 million, almost double 2019 levels. This pales into comparison with publicly traded high yield bonds for which average daily traded volume was US$5.8 billion in 2023 (ADV in 2019 US$7.4 billion) but was only slightly below US asset backed securities markets (ADV was US$926 million and US$1.1 billion in 2023 and 2019, respectively). While CLOs should not be equated with private credit in terms of illiquidity, there is some level of illiquidity premium available. If private credit provides a 2% illiquidity premium, the illiquidity premium on CLOs might be closer to 1%.4
However even after controlling for credit risk, convexity and illiquidity, there is still an unexplained premium of 0.50-1% per annum in spread terms. We think this premium exists because even today, some investors remain closed minded about CLOs. Yes, there is absolutely complexity in the asset class. And it requires experienced investment managers who understand the underlying leveraged loans, the incentives of the CLO managers themselves and the way the structures work.
In an environment of higher interest rates and potentially greater credit stress, we think CLOs can be an effective tool to transition your portfolio away from high yield credit or equity risk into an investment grade credit risk profile without a material reduction in returns. That’s a pretty good reason to stay open minded!
As always, thanks for reading.